Open Access
Fig. 16
Download original image
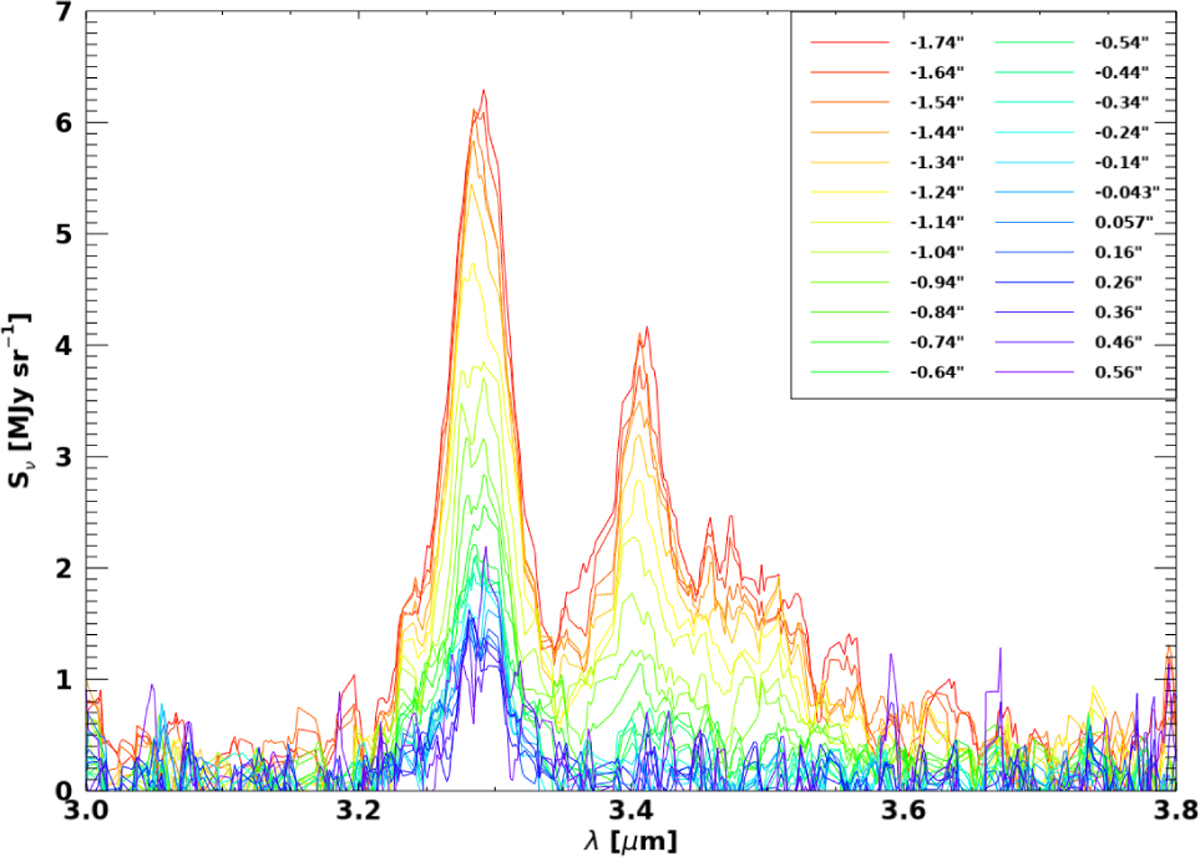
Spectra from individual spaxels across the PDR front. Colors correspond to distance along the long axis of the IFU mosaic relative to the dissociation front defined in Abergel et al. (2024), with red being deepest into the cloud and purple at the edge of the IFU footprint nearest the exciting star.
Current usage metrics show cumulative count of Article Views (full-text article views including HTML views, PDF and ePub downloads, according to the available data) and Abstracts Views on Vision4Press platform.
Data correspond to usage on the plateform after 2015. The current usage metrics is available 48-96 hours after online publication and is updated daily on week days.
Initial download of the metrics may take a while.