Fig. 20
Download original image
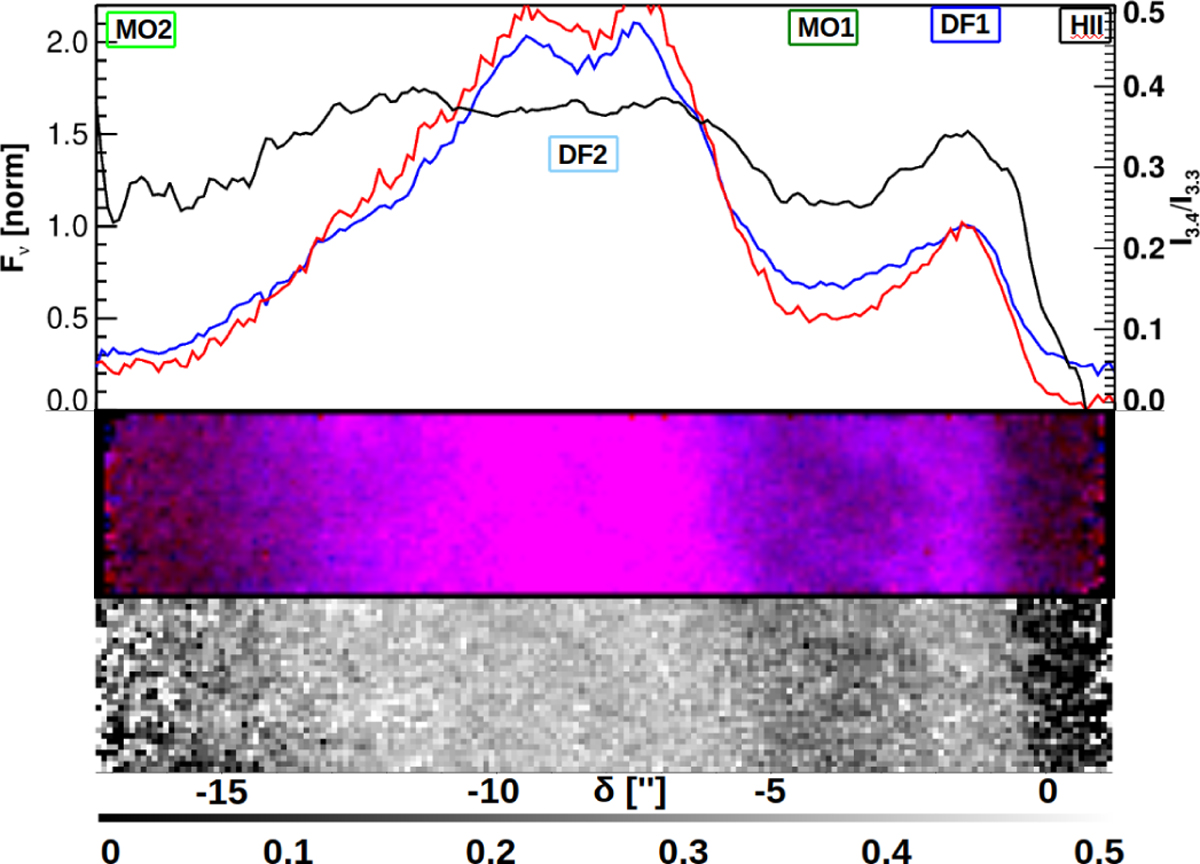
Horsehead per pixel maps of the aliphatic (3.4 μm) and aromatic (3.3 μm) integrated band strength. Middle panel: aromatic in blue, aliphatic in red. Bottom panel: ratio of aliphatic to aromatic band strengths. Top panel: cuts along the long mosaic axis. Aromatic and aliphatic cuts are in blue and red, respectively (as for the middle panel), and the band ratio is plotted in black; see the y-axis on the right.
Current usage metrics show cumulative count of Article Views (full-text article views including HTML views, PDF and ePub downloads, according to the available data) and Abstracts Views on Vision4Press platform.
Data correspond to usage on the plateform after 2015. The current usage metrics is available 48-96 hours after online publication and is updated daily on week days.
Initial download of the metrics may take a while.