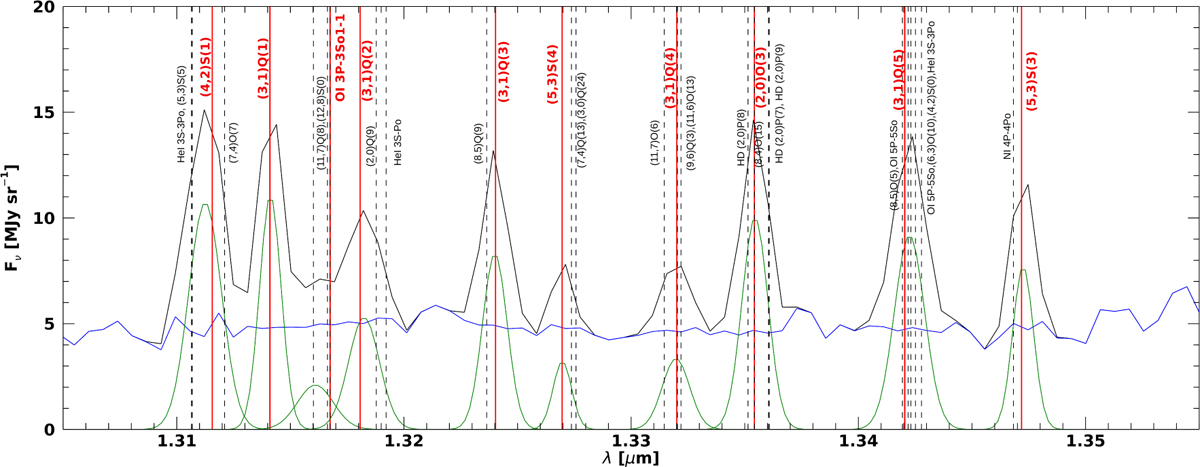
Fig. 4
Download original image
Plot of a narrow wavelength slice of the NIRSpec G140M spectrum in DF1 qualitatively illustrating line identification. The black line is the extracted spectrum, green the Gaussian fits to identified lines, and blue the continuum after subtracting the green fits from the extracted spectrum. Vertical red lines and red text provide the final line identifications, while vertical dashed lines show all species initially identified as candidates.
Current usage metrics show cumulative count of Article Views (full-text article views including HTML views, PDF and ePub downloads, according to the available data) and Abstracts Views on Vision4Press platform.
Data correspond to usage on the plateform after 2015. The current usage metrics is available 48-96 hours after online publication and is updated daily on week days.
Initial download of the metrics may take a while.