Fig. 5
Download original image
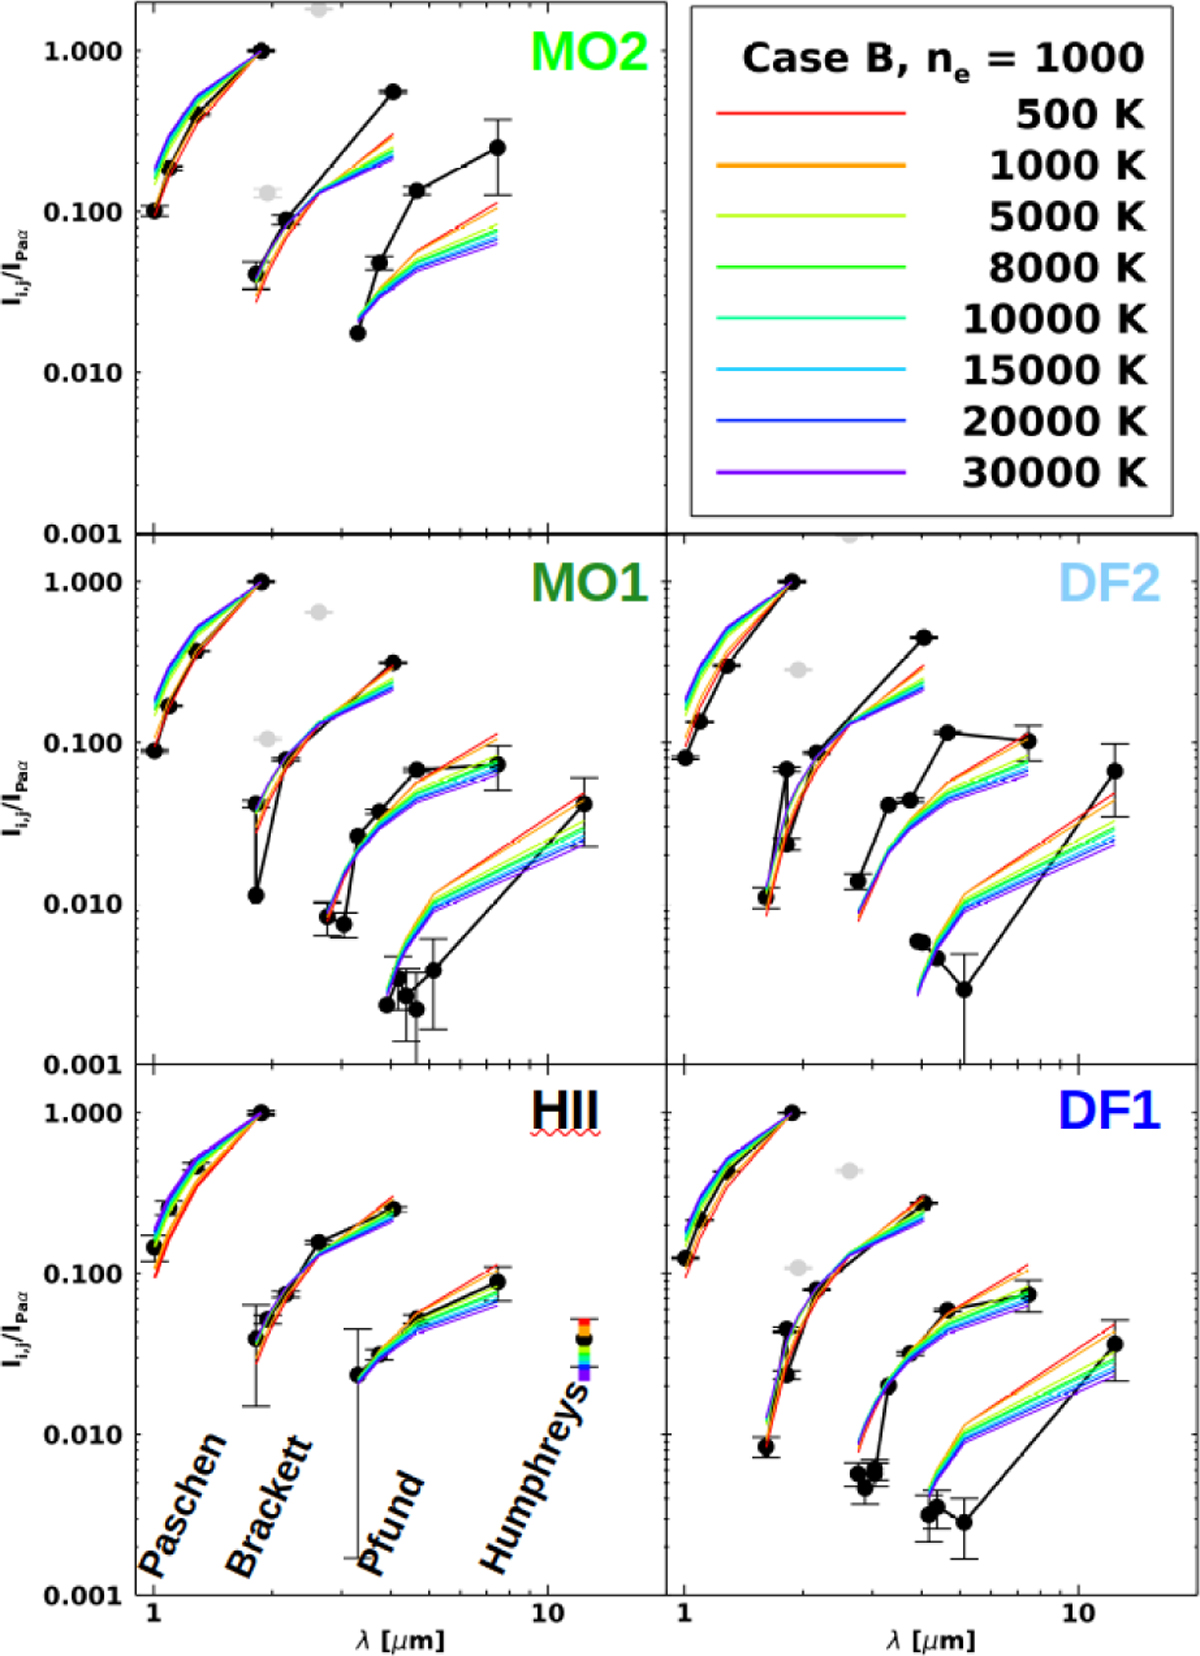
Measured line hydrogen line ratios, normalized to Pa α for the five regions in the Horsehead. Over plotted in colored lines are the theoretical ratios for a range of temperatures from Prozesky & Smits (2018). All the theoretical ratios are computed for a density of 1000 cm−3. Observed series are, left to right, Paschen, Brackett, Pfund, and Humphreys. Except for the H II region, 4–8 and 4–6 in the Brackett are plotted as light gray symbols as they are confused with nearby H2 lines.
Current usage metrics show cumulative count of Article Views (full-text article views including HTML views, PDF and ePub downloads, according to the available data) and Abstracts Views on Vision4Press platform.
Data correspond to usage on the plateform after 2015. The current usage metrics is available 48-96 hours after online publication and is updated daily on week days.
Initial download of the metrics may take a while.