Fig. 6
Download original image
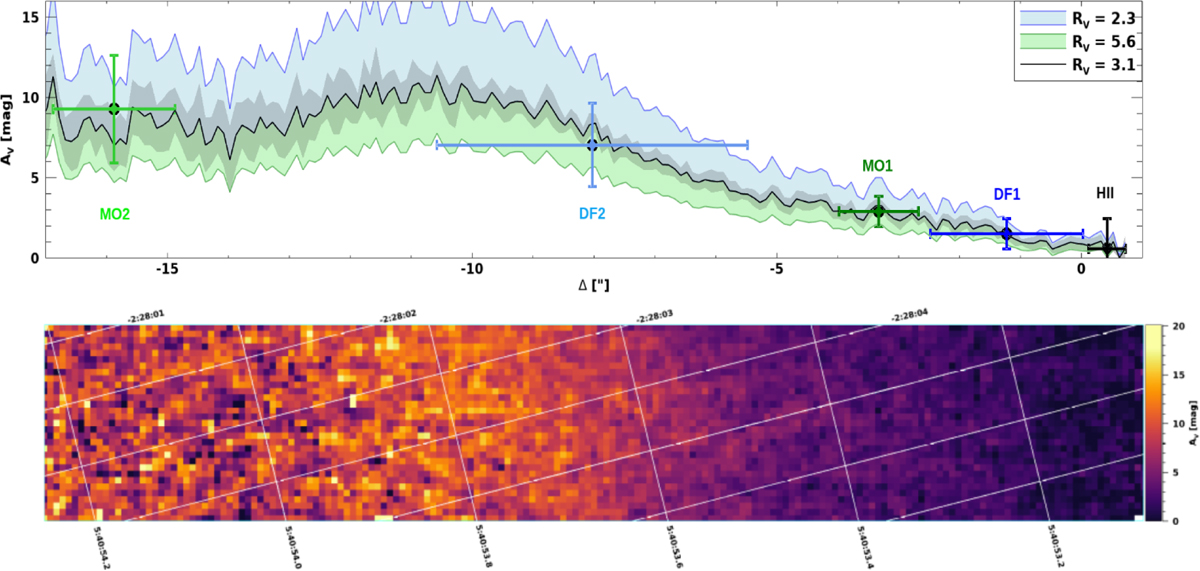
Bottom: spatial distribution of AV in the Horsehead IFU footprint as estimated using Eq. (2) with RV = 3.1. Top: estimates of AV extracted from each region (points) along with a cut-through the spatial distribution map. Error bars on AV for the region extractions are dominated by variation over the full region; “error” bars on the distance from the front are defined as the rough width of the region definition; see Fig. 1.
Current usage metrics show cumulative count of Article Views (full-text article views including HTML views, PDF and ePub downloads, according to the available data) and Abstracts Views on Vision4Press platform.
Data correspond to usage on the plateform after 2015. The current usage metrics is available 48-96 hours after online publication and is updated daily on week days.
Initial download of the metrics may take a while.