Fig. 7
Download original image
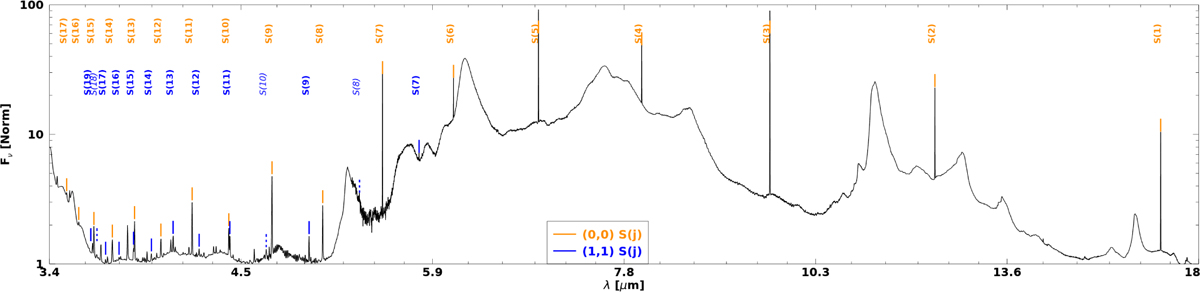
Plot illustrating the lines in the pure rotational (0,0) and (1,1) series of H2 (orange and blue, respectively) for the DF1 region of NGC 7023. Identifications in italics with a dashed line were not included in final line lists – the (1,1)S(18,10,8) lines were weak and in complex regions of the spectrum, making extraction uncertain.
Current usage metrics show cumulative count of Article Views (full-text article views including HTML views, PDF and ePub downloads, according to the available data) and Abstracts Views on Vision4Press platform.
Data correspond to usage on the plateform after 2015. The current usage metrics is available 48-96 hours after online publication and is updated daily on week days.
Initial download of the metrics may take a while.