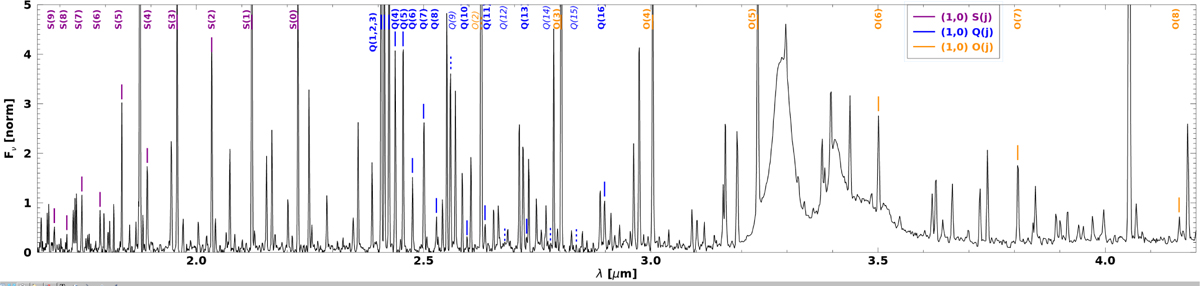
Fig. 8
Download original image
Plot illustrating the lines in the S, Q, and O branches (purple, blue, and orange, respectively) of the H2 (1,0) transitions for the DF1 region of the Horsehead. Identifications in italics with a dashed line were not included in final line lists − Q(9) is blended with the H2 (2,1)Q(2) transition and not extracted independently while Q(12), Q(14), and Q(15) were very weak and not definitively detected. In addition, the O(2) line is blended with H I Br β and not independently extracted.
Current usage metrics show cumulative count of Article Views (full-text article views including HTML views, PDF and ePub downloads, according to the available data) and Abstracts Views on Vision4Press platform.
Data correspond to usage on the plateform after 2015. The current usage metrics is available 48-96 hours after online publication and is updated daily on week days.
Initial download of the metrics may take a while.