Fig. 10.
Download original image
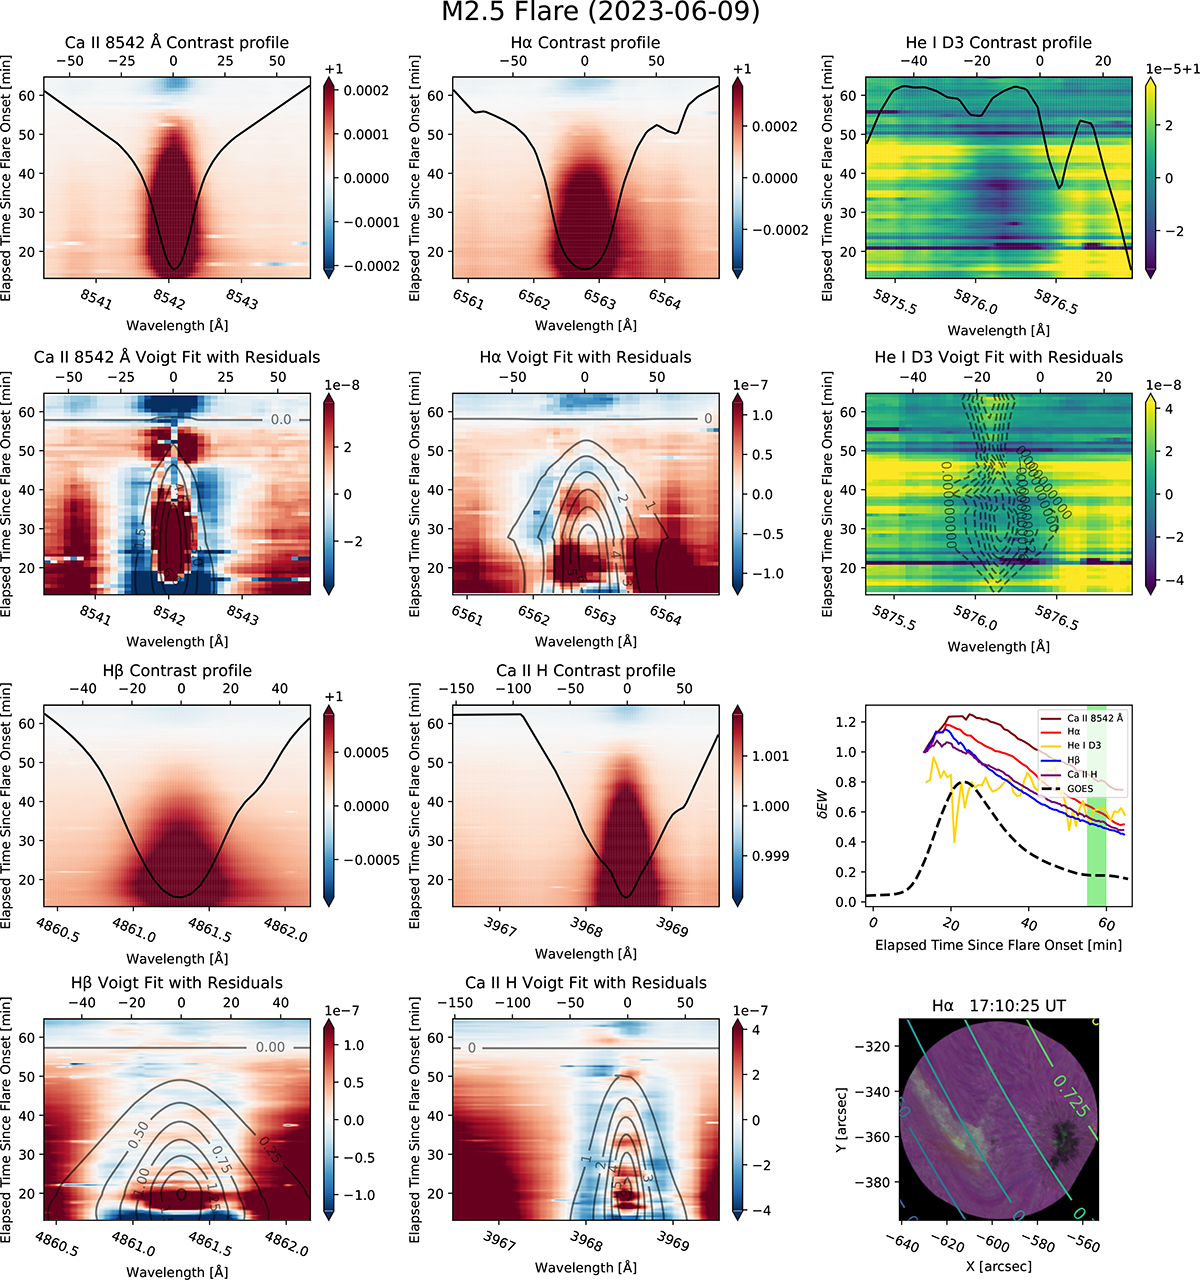
Event 7. Same as Fig. 4 but for Ca II 8542 Å, Hα, He I D3, Hβ, and Ca II H. In the top right panel,the absorption features in the quiet-Sun profile (black curve) are blends of multiple telluric H2O and solar metallic lines (see Fig. 2 in Libbrecht et al. (2017) and the top panels of Fig. 4.4 in Libbrecht (2019)). The He I D3 contrast profile corresponds to the dark region approximately within the ranges 5876.00–5876.50 Å and 25–45 min. The colorbar values of C(λ, t) are on the order of 10−5 and offset by +1, as indicated at the top of the colorbar as 1e − 5 + 1. This formatting is also used in some of the subsequent figures. In the right column, third panel from the top, the δEW curve of He I D3 has been offset by 1.8 for better comparison.
Current usage metrics show cumulative count of Article Views (full-text article views including HTML views, PDF and ePub downloads, according to the available data) and Abstracts Views on Vision4Press platform.
Data correspond to usage on the plateform after 2015. The current usage metrics is available 48-96 hours after online publication and is updated daily on week days.
Initial download of the metrics may take a while.