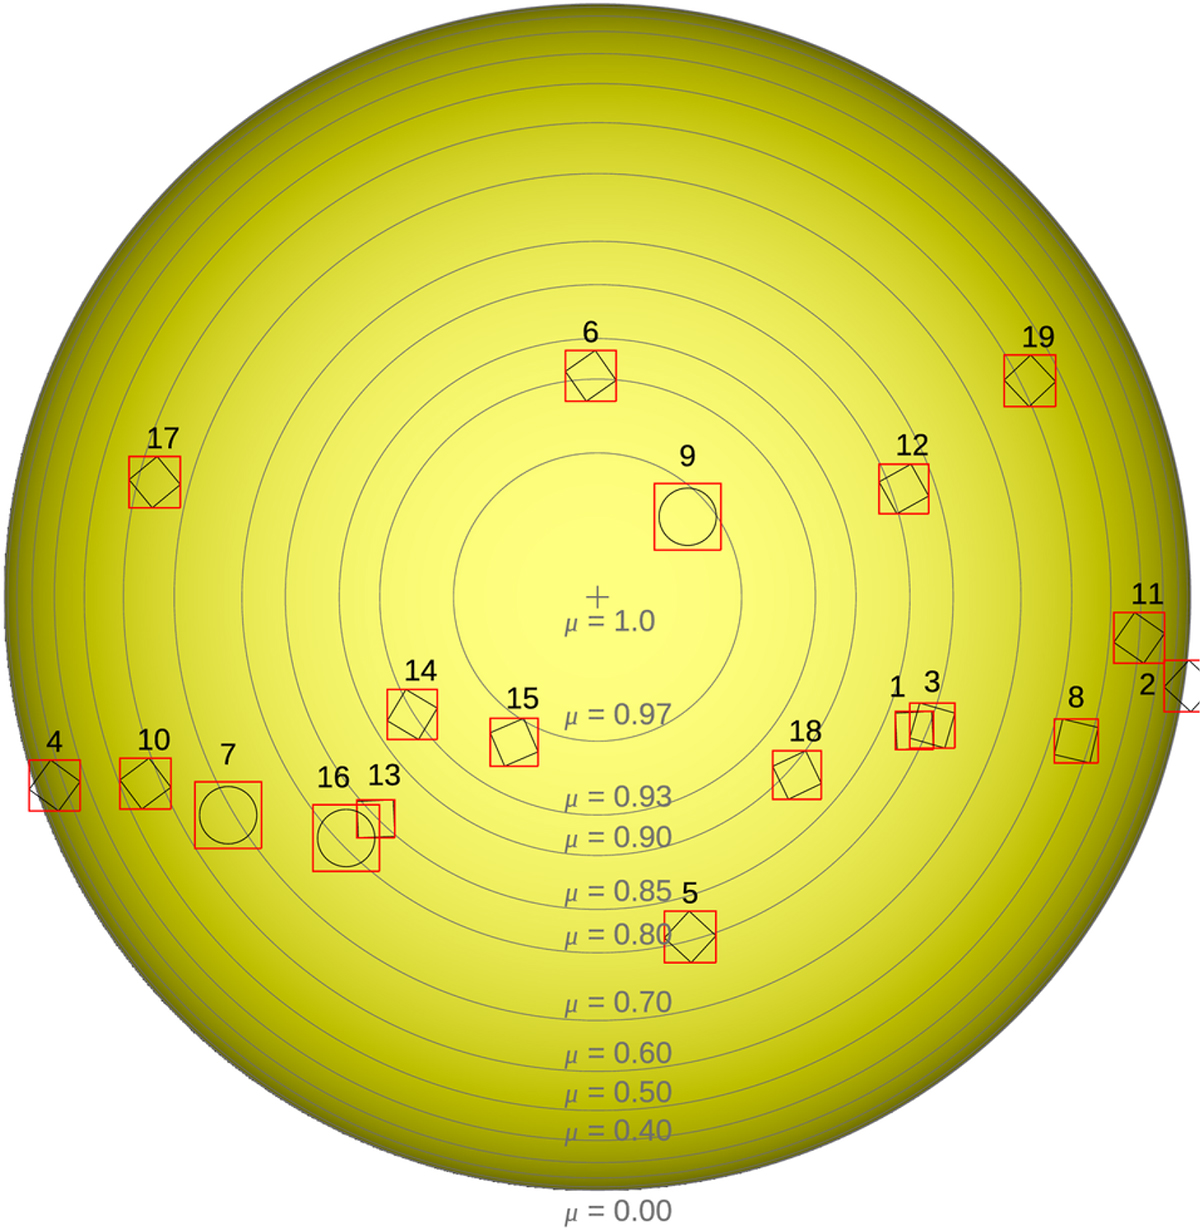
Fig. 2.
Download original image
Flare locations on the solar disk (red boxes) labeled with event numbers from Table A.1. Tilted black squares and black circles (corresponding to Events 7, 9, and 16) approximately match the CRISP or CHROMIS FOV in the COCOPLOTS in Figs. 4–21. Gray concentric circles correspond to directional cosines μ, labeled accordingly, with the disk center marked by a plus sign.
Current usage metrics show cumulative count of Article Views (full-text article views including HTML views, PDF and ePub downloads, according to the available data) and Abstracts Views on Vision4Press platform.
Data correspond to usage on the plateform after 2015. The current usage metrics is available 48-96 hours after online publication and is updated daily on week days.
Initial download of the metrics may take a while.