Fig. 3.
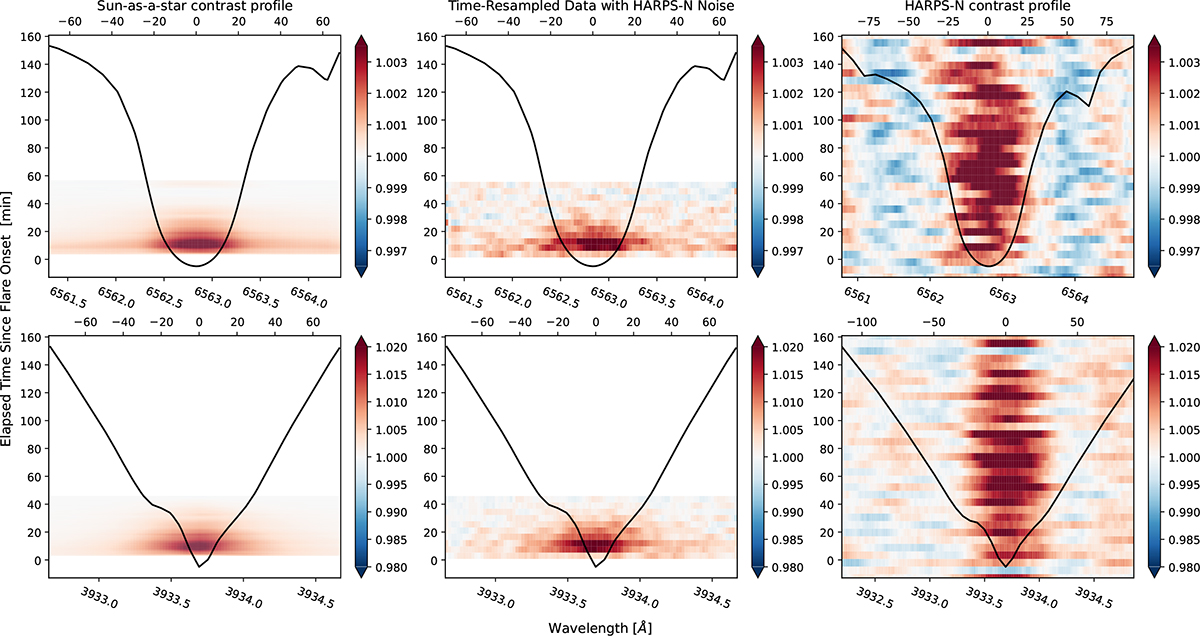
Download original image
Construction process of the temporal variation of the Sun-as-a-star contrast profile, C(λ, t) (Eq. (4)), with a resolution equivalent to HARPS-N, derived from high-resolution SST observations of the X9.3 flare, listed as Event 1 in Table A.1, for Hα (top row) and Ca II K (bottom row). Each panel presents the contrast profile relative to quiet-Sun profiles (black curves). Color bars denote the values of C(λ, t). Left column: Sun-as-a-star contrast profiles generated using the NESSI code. Middle column: Same as the left column but resampled to the HARPS-N temporal resolution of 5 minutes and degraded by adding normally distributed noise with a standard deviation estimated from the wings of line profiles observed by HARPS-N. Right column: Contrast profiles of Hα and Ca II K reconstructed from HARPS-N observations of Event 1, shown also in Fig. 4.
Current usage metrics show cumulative count of Article Views (full-text article views including HTML views, PDF and ePub downloads, according to the available data) and Abstracts Views on Vision4Press platform.
Data correspond to usage on the plateform after 2015. The current usage metrics is available 48-96 hours after online publication and is updated daily on week days.
Initial download of the metrics may take a while.