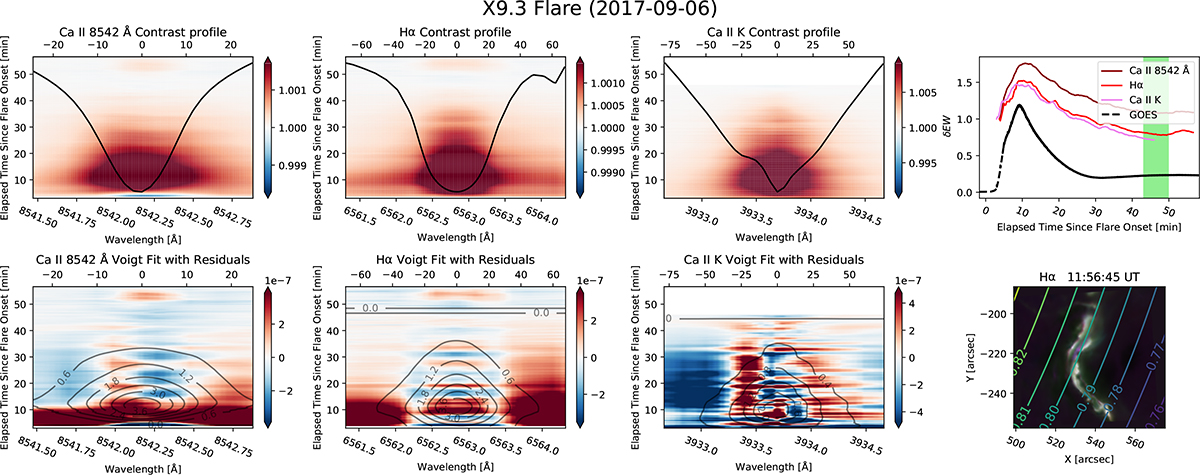
Fig. 4.
Download original image
Event 1. Top row: Temporal variations of the Sun-as-a-star contrast profile, C(λ, t) (Eq. (4)), for the Ca II 8542 Å, Hα, and Ca II K lines, respectively. Each panel shows the contrast profile relative to quiet-Sun profiles (black curves) and the relative differenced equivalent widths δEW (top right panel), integrated over Δλ = ±0.5 Å around the line centers (Eq. (7)) and normalized relative to the |ΔEW(t0)| value of particular line at the SST Start time t0 (Table A.1). The green bar marks the reference time span Δt, which serves as the reference for the contrast profile C(λ, t). The GOES X-ray flux in the 1–8 Å range is overplotted after ad hoc scaling. Color bars indicate the values of C(λ, t). Bottom row: Temporal variations of the model function (Eq. (10)) for the Ca II 8542 Å, Hα, and Ca II K lines, represented by black contours, plotted over the residuals R(λ, t) of the fits (Eq. (11)). The contours are labeled by spectral intensities normalized to the quiet-Sun continuum spectral intensity. The contour labeled 0 approximately corresponds to the midpoint of the time span Δt, represented by the green bar in the δEW panel. The dashed contours indicate negative values. Color bars indicate the values of R(λ, t). The top x-axes display velocities in km s−1 corresponding to Doppler shifts relative to the line centers. Bottom right panel: The cocoplot overlaid with contours of the respective directional cosines μ (Druett et al. 2022).
Current usage metrics show cumulative count of Article Views (full-text article views including HTML views, PDF and ePub downloads, according to the available data) and Abstracts Views on Vision4Press platform.
Data correspond to usage on the plateform after 2015. The current usage metrics is available 48-96 hours after online publication and is updated daily on week days.
Initial download of the metrics may take a while.