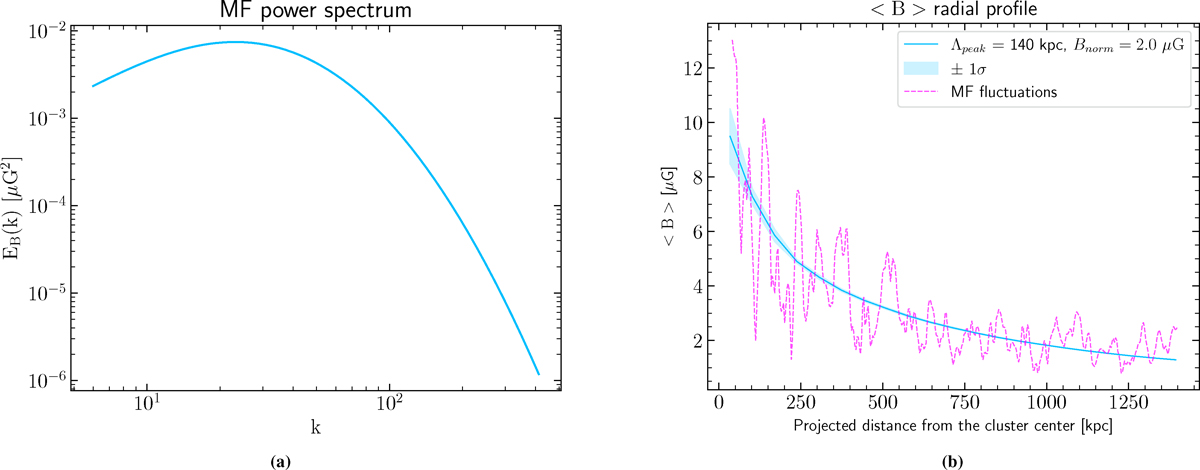
Fig. 11.
Download original image
Panel (a): Best-fit MF power spectrum, ranging between Λmin = 7 kpc (kmax = 413) and Λmax = 470 kpc (kmin = 6), with peak at ∼140 kpc (C = 10.1 Mpc−1, k ∼ 20). Panel (b): Profile of ⟨B⟩ as a function of the projected distance from the cluster centre. It is the mean over five simulations and the scatter is the standard deviation. The central average MF, ⟨B0⟩, is equal to 9.5 ± 1.0 μG. Dashed pink line represents the MF fluctuations taken along the central LOS.
Current usage metrics show cumulative count of Article Views (full-text article views including HTML views, PDF and ePub downloads, according to the available data) and Abstracts Views on Vision4Press platform.
Data correspond to usage on the plateform after 2015. The current usage metrics is available 48-96 hours after online publication and is updated daily on week days.
Initial download of the metrics may take a while.