Fig. 2.
Download original image
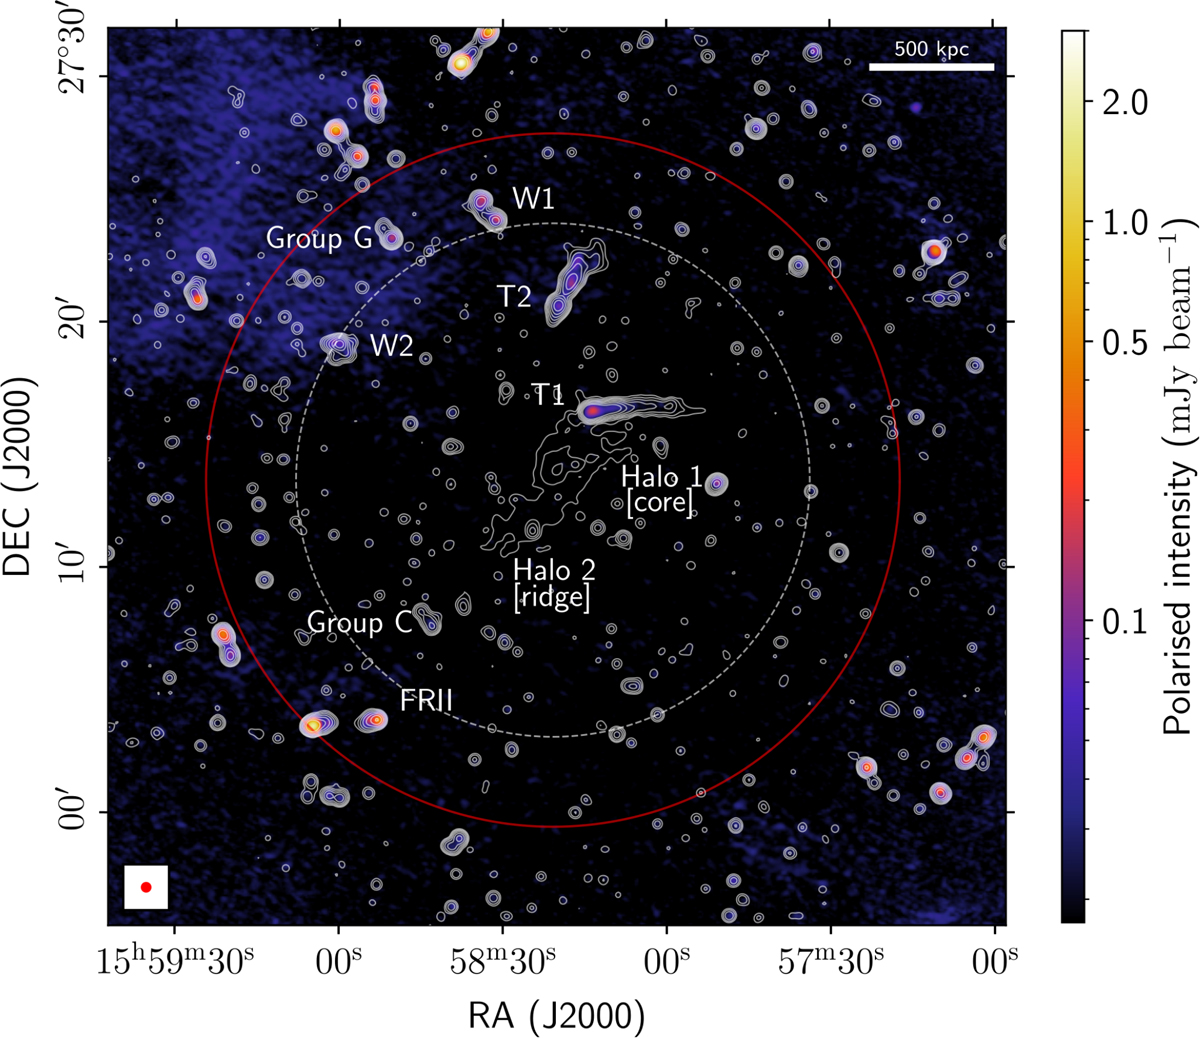
Map of the maximum polarised intensity in each pixel obtained with the RM synthesis technique, with overlaid radio contours from 3σI and scaling by a factor of 2. The Galactic bubble polarised emission can be seen in the top-left side of the image. Dashed circle corresponds to the reference distance of 1 Mpc from the cluster centre. Solid red line represent the 0.23° (∼1381 kpc) separation threshold for MeerKAT off-axis leakage in the L-band above 1.4 GHz. Spatial scales and resolution beam are reported on the edges of the map.
Current usage metrics show cumulative count of Article Views (full-text article views including HTML views, PDF and ePub downloads, according to the available data) and Abstracts Views on Vision4Press platform.
Data correspond to usage on the plateform after 2015. The current usage metrics is available 48-96 hours after online publication and is updated daily on week days.
Initial download of the metrics may take a while.