Fig. 3.
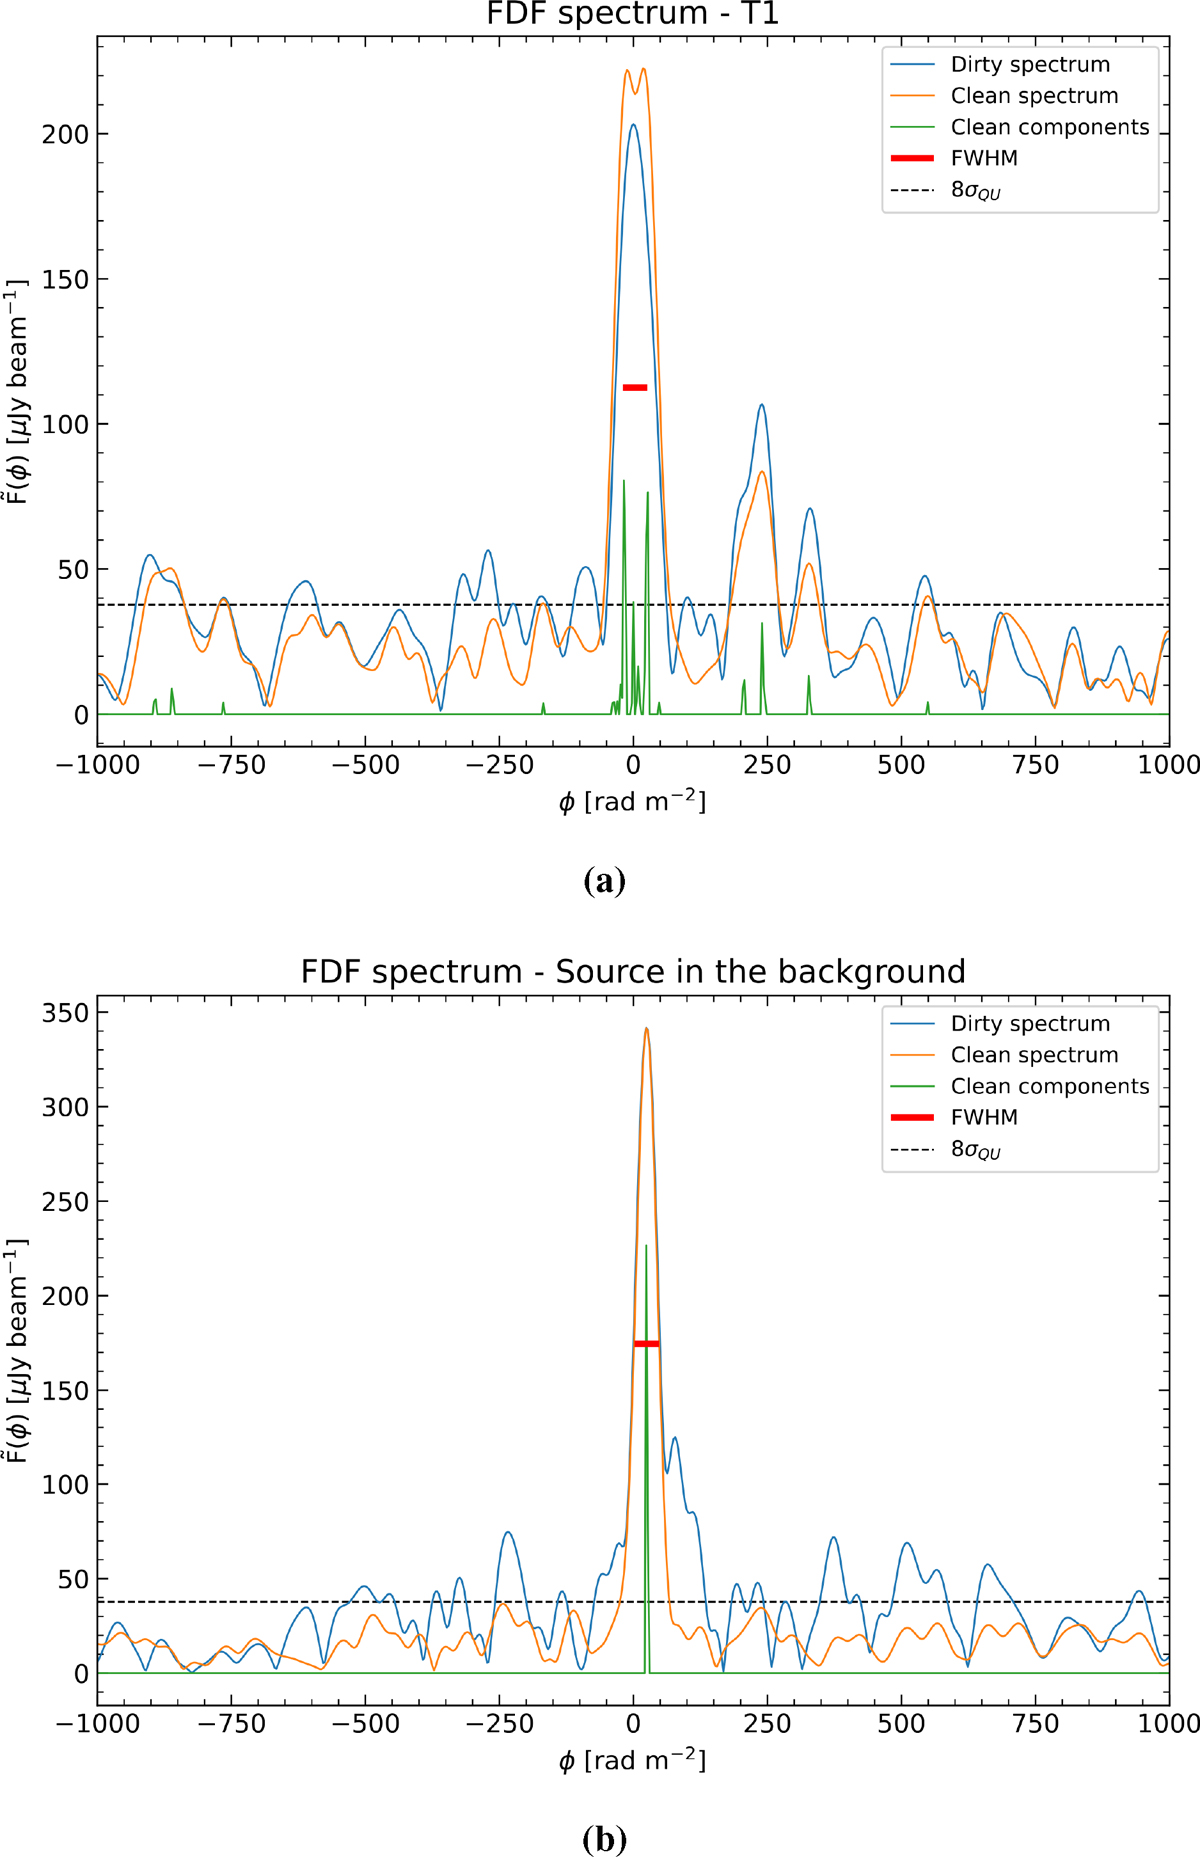
Download original image
Reconstructed FDF spectrum taken from the brightest polarised pixel of some sources in the field. Panel (a): T1. Panel (b): Source in the background. The dirty spectrum is shown in blue, the clean spectrum in orange and the clean components in green. The FWHM of the RMTF is reported in red and the 8σQU with the black dashed line as a reference.
Current usage metrics show cumulative count of Article Views (full-text article views including HTML views, PDF and ePub downloads, according to the available data) and Abstracts Views on Vision4Press platform.
Data correspond to usage on the plateform after 2015. The current usage metrics is available 48-96 hours after online publication and is updated daily on week days.
Initial download of the metrics may take a while.