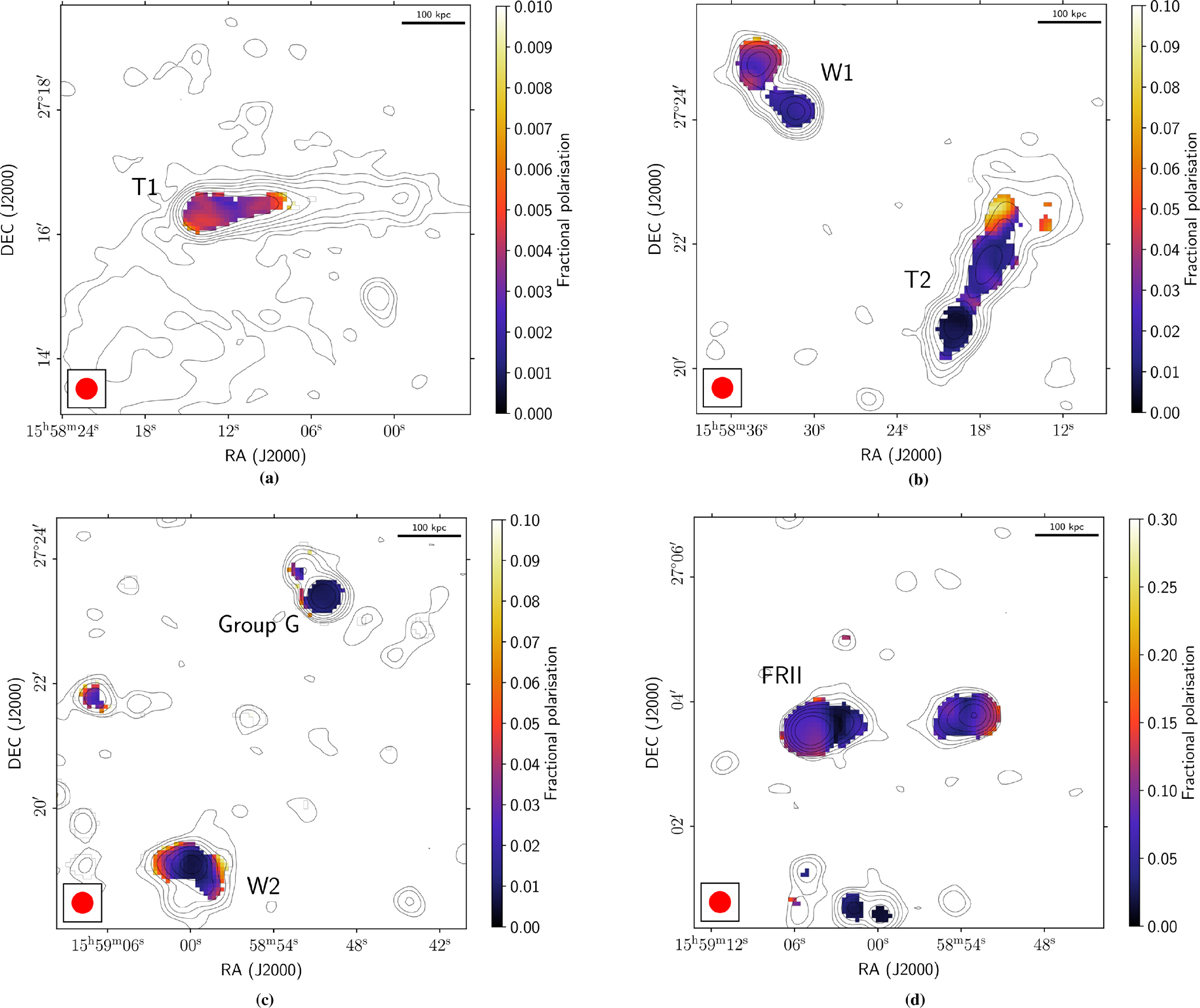
Fig. 5.
Download original image
Zoom of the Fp map in correspondence of some sources analysed in this work with overlaid radio contours (1283 MHz), from 3σI and scaling by a factor of 2. The 6σQU and 3σI detection thresholds were imposed in polarisation and in total intensity and only pixels above them are shown. Values were corrected for the Ricean bias. Panel (a): T1. Panel (b): T2 and W1. Panel (c): W2 and Group G. Panel (d): FRII. Spatial scales and resolution beam are reported on the edges of the images.
Current usage metrics show cumulative count of Article Views (full-text article views including HTML views, PDF and ePub downloads, according to the available data) and Abstracts Views on Vision4Press platform.
Data correspond to usage on the plateform after 2015. The current usage metrics is available 48-96 hours after online publication and is updated daily on week days.
Initial download of the metrics may take a while.