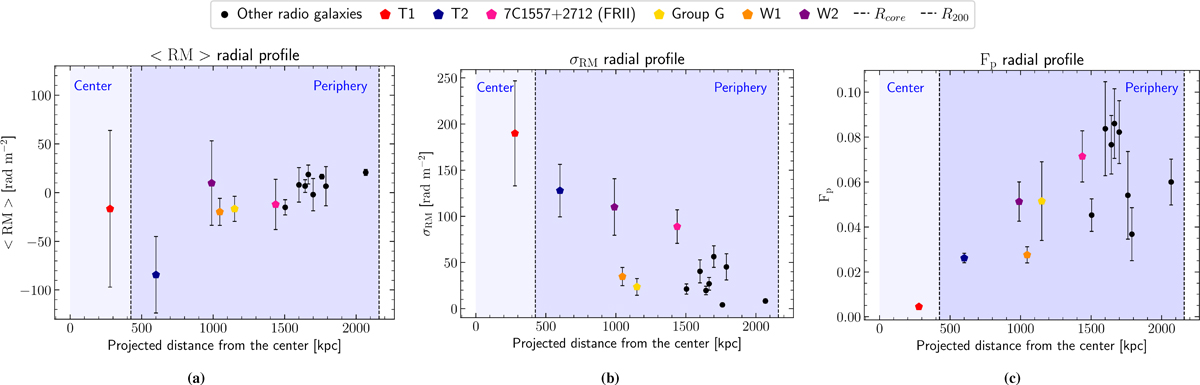
Fig. 6.
Download original image
⟨RM⟩, σRM, and Fp as a function of the projected distance from the cluster centre. The known sources are represented with the coloured pentagons, whereas the other radio galaxies (listed in Table 5) with the black dots. Panel (a): ⟨RM⟩ radial profile. Panel (b): σRM radial profile. Panel (c): Fp radial profile. The errors are computed following Eqs. (2) and (3). Reference distances, such as Rcore = 425.60 ± 20.03 kpc (Henry & Briel 1996) and R200 = 2.16 ± 0.08 Mpc (Munari et al. 2014), are reported with the dashed lines to discriminate the central from the peripheral regions of the cluster.
Current usage metrics show cumulative count of Article Views (full-text article views including HTML views, PDF and ePub downloads, according to the available data) and Abstracts Views on Vision4Press platform.
Data correspond to usage on the plateform after 2015. The current usage metrics is available 48-96 hours after online publication and is updated daily on week days.
Initial download of the metrics may take a while.