Open Access
Fig. 12
Download original image
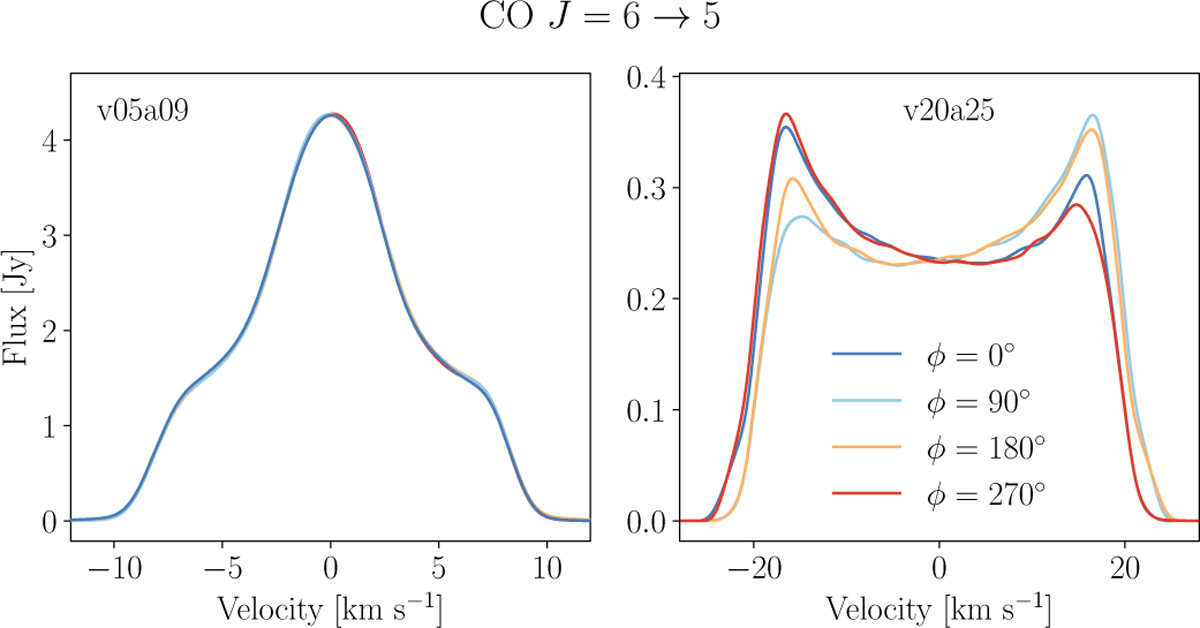
Synthetic CO J = 6→5 spectral lines for the v05a09 (left) and v20a25 (right) models, viewed edge-on and at four different values of the PA (ϕ). The different colours correspond to the different values of the PA.
Current usage metrics show cumulative count of Article Views (full-text article views including HTML views, PDF and ePub downloads, according to the available data) and Abstracts Views on Vision4Press platform.
Data correspond to usage on the plateform after 2015. The current usage metrics is available 48-96 hours after online publication and is updated daily on week days.
Initial download of the metrics may take a while.