Fig. 4
Download original image
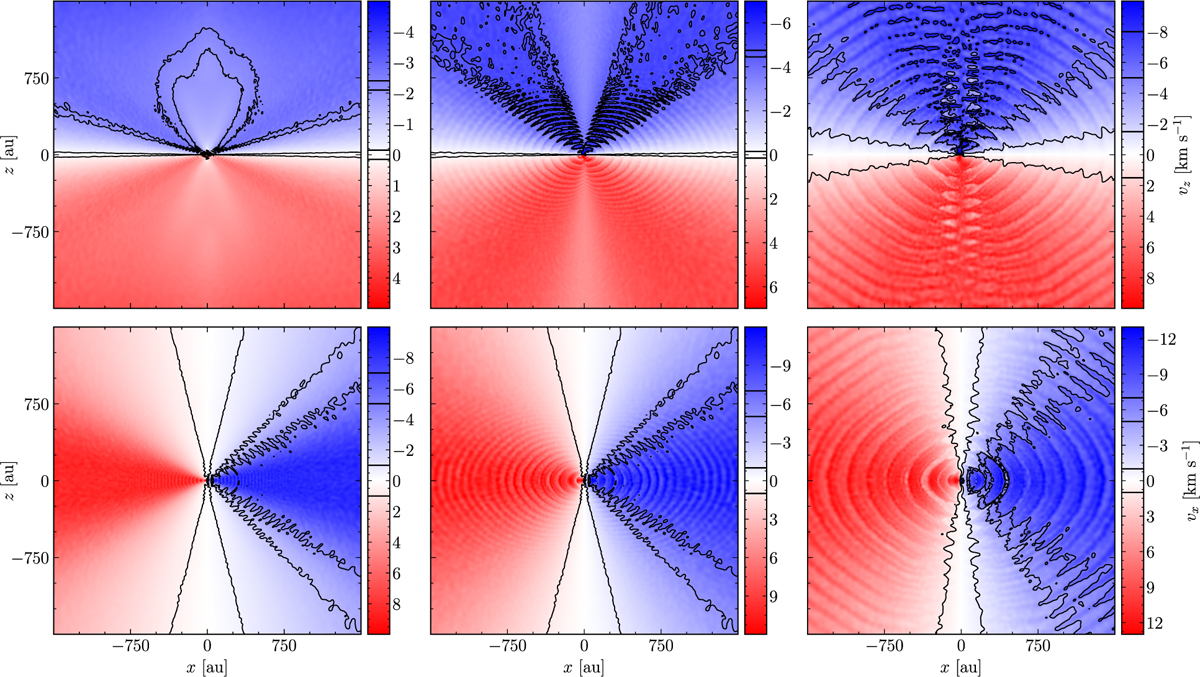
Velocities in the z direction (upper row) and in the x direction (lower row) in slices through the meridional plane for the models with initial wind velocities of 10 km s−1. Contours are shown on the plots around velocities interesting for the line profiles, indicated by the horizontal lines on the colour bar. From left to right, the orbital separation is 9, 15, and 25 au.
Current usage metrics show cumulative count of Article Views (full-text article views including HTML views, PDF and ePub downloads, according to the available data) and Abstracts Views on Vision4Press platform.
Data correspond to usage on the plateform after 2015. The current usage metrics is available 48-96 hours after online publication and is updated daily on week days.
Initial download of the metrics may take a while.