Fig. 4.
Download original image
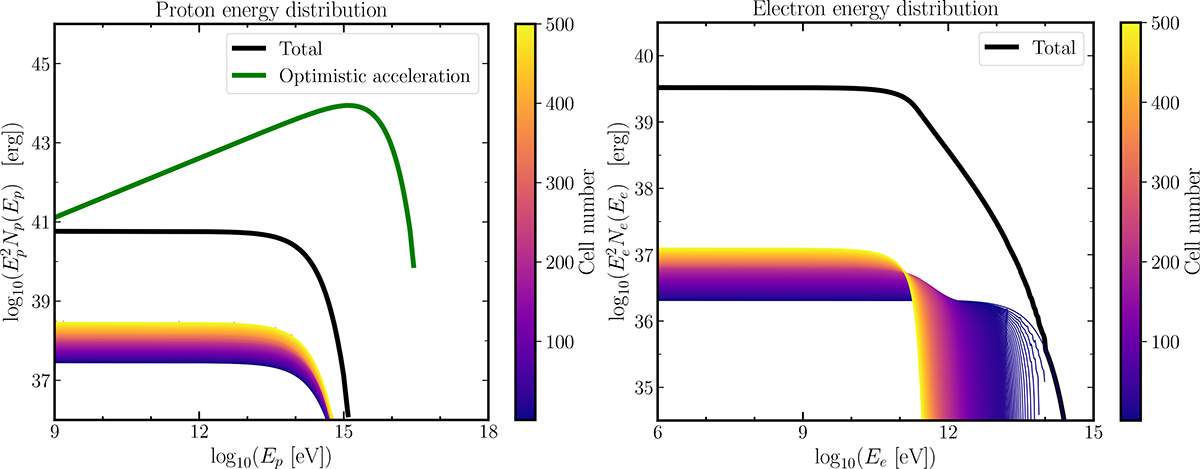
Relativistic particle energy distributions for protons (left panel) and electrons (right panel). The coloured scale shows the distribution at each cell. The black line represents the total energy distribution (i.e. the sum over all cells). The green line corresponds to an alternative scenario with optimistic acceleration and injection, where the maximum energy is given by ![]() , the luminosity injected into protons is
, the luminosity injected into protons is ![]() , and with a harder spectral index p > −2. The optimistic approach is not applicable for electrons due to synchrotron losses at energies E ≳ 120 GeV.
, and with a harder spectral index p > −2. The optimistic approach is not applicable for electrons due to synchrotron losses at energies E ≳ 120 GeV.
Current usage metrics show cumulative count of Article Views (full-text article views including HTML views, PDF and ePub downloads, according to the available data) and Abstracts Views on Vision4Press platform.
Data correspond to usage on the plateform after 2015. The current usage metrics is available 48-96 hours after online publication and is updated daily on week days.
Initial download of the metrics may take a while.