Fig. 5.
Download original image
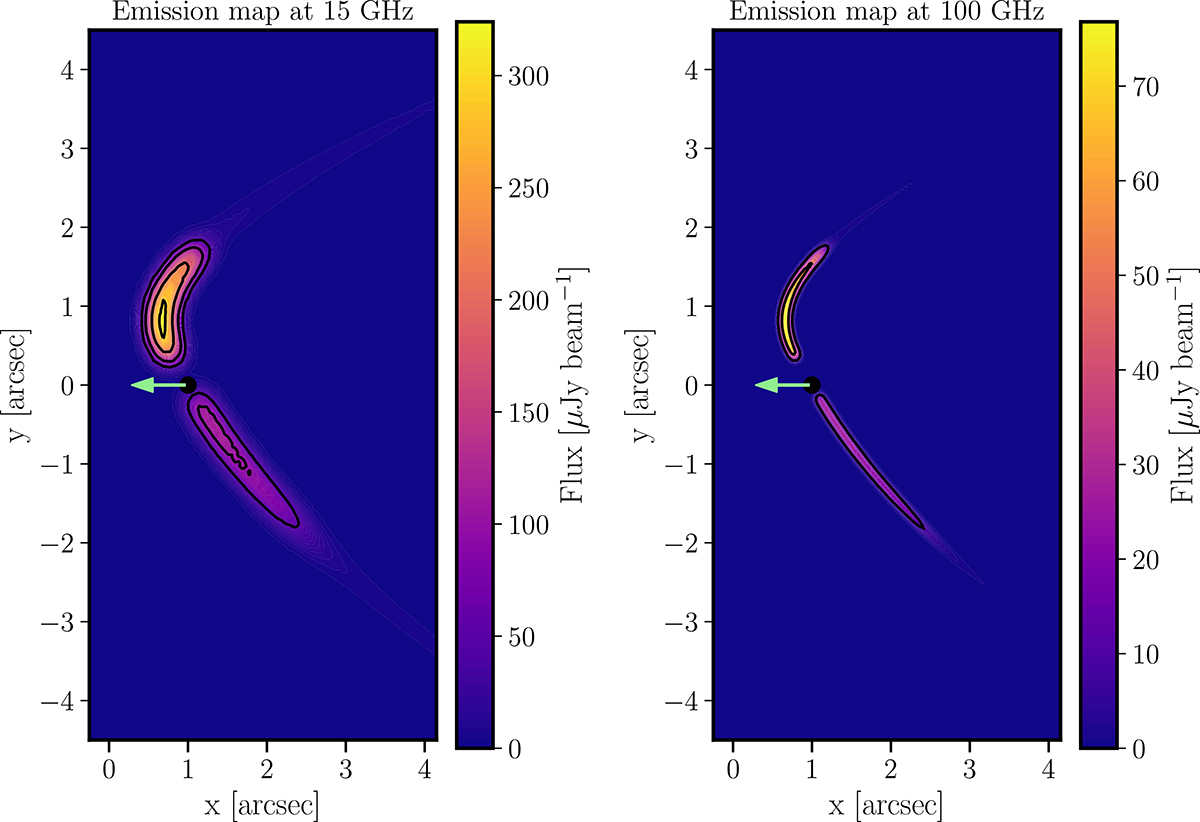
Simulated emission maps at 15 GHz (left panel) and at 100 GHz (right panel) with beam sizes of 0.13″ × 0.13″ and 0.042″ × 0.042″, respectively. The forward interaction structure is a bright arc. The black dot shows the position of the IBH, and the green left-arrow shows its direction of motion. The black contour levels are at 50, 100, 200 and 300 μJy beam−1 in the left panel, and at 10 and 50 μJy beam−1 in the right panel.
Current usage metrics show cumulative count of Article Views (full-text article views including HTML views, PDF and ePub downloads, according to the available data) and Abstracts Views on Vision4Press platform.
Data correspond to usage on the plateform after 2015. The current usage metrics is available 48-96 hours after online publication and is updated daily on week days.
Initial download of the metrics may take a while.