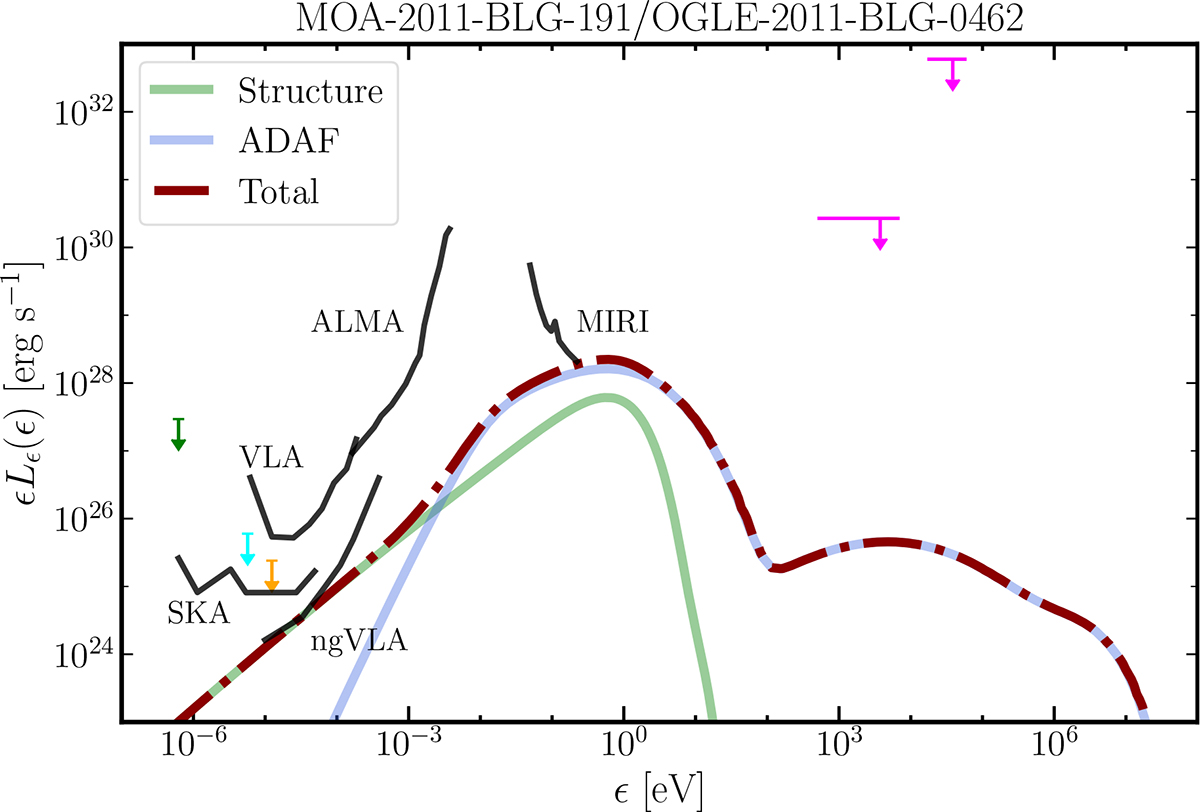
Fig. 6.
Download original image
MOA-2011-BLG-191/OGLE-2011-BLG-0462 unabsorbed predicted spectrum. The interaction structure, accretion, and total emission are shown in light blue, light red and dark red, respectively. The 3-σ upper limits from the TGSS, RACS and VLASS catalogues are shown with green, cyan and orange arrows, while the upper limits from Mereghetti et al. (2022) are shown in magenta. The SKA and ngVLA sensitivity curves correspond to an integration time of 2 h (Sokolowski et al. 2022; McKinnon et al. 2019).
Current usage metrics show cumulative count of Article Views (full-text article views including HTML views, PDF and ePub downloads, according to the available data) and Abstracts Views on Vision4Press platform.
Data correspond to usage on the plateform after 2015. The current usage metrics is available 48-96 hours after online publication and is updated daily on week days.
Initial download of the metrics may take a while.