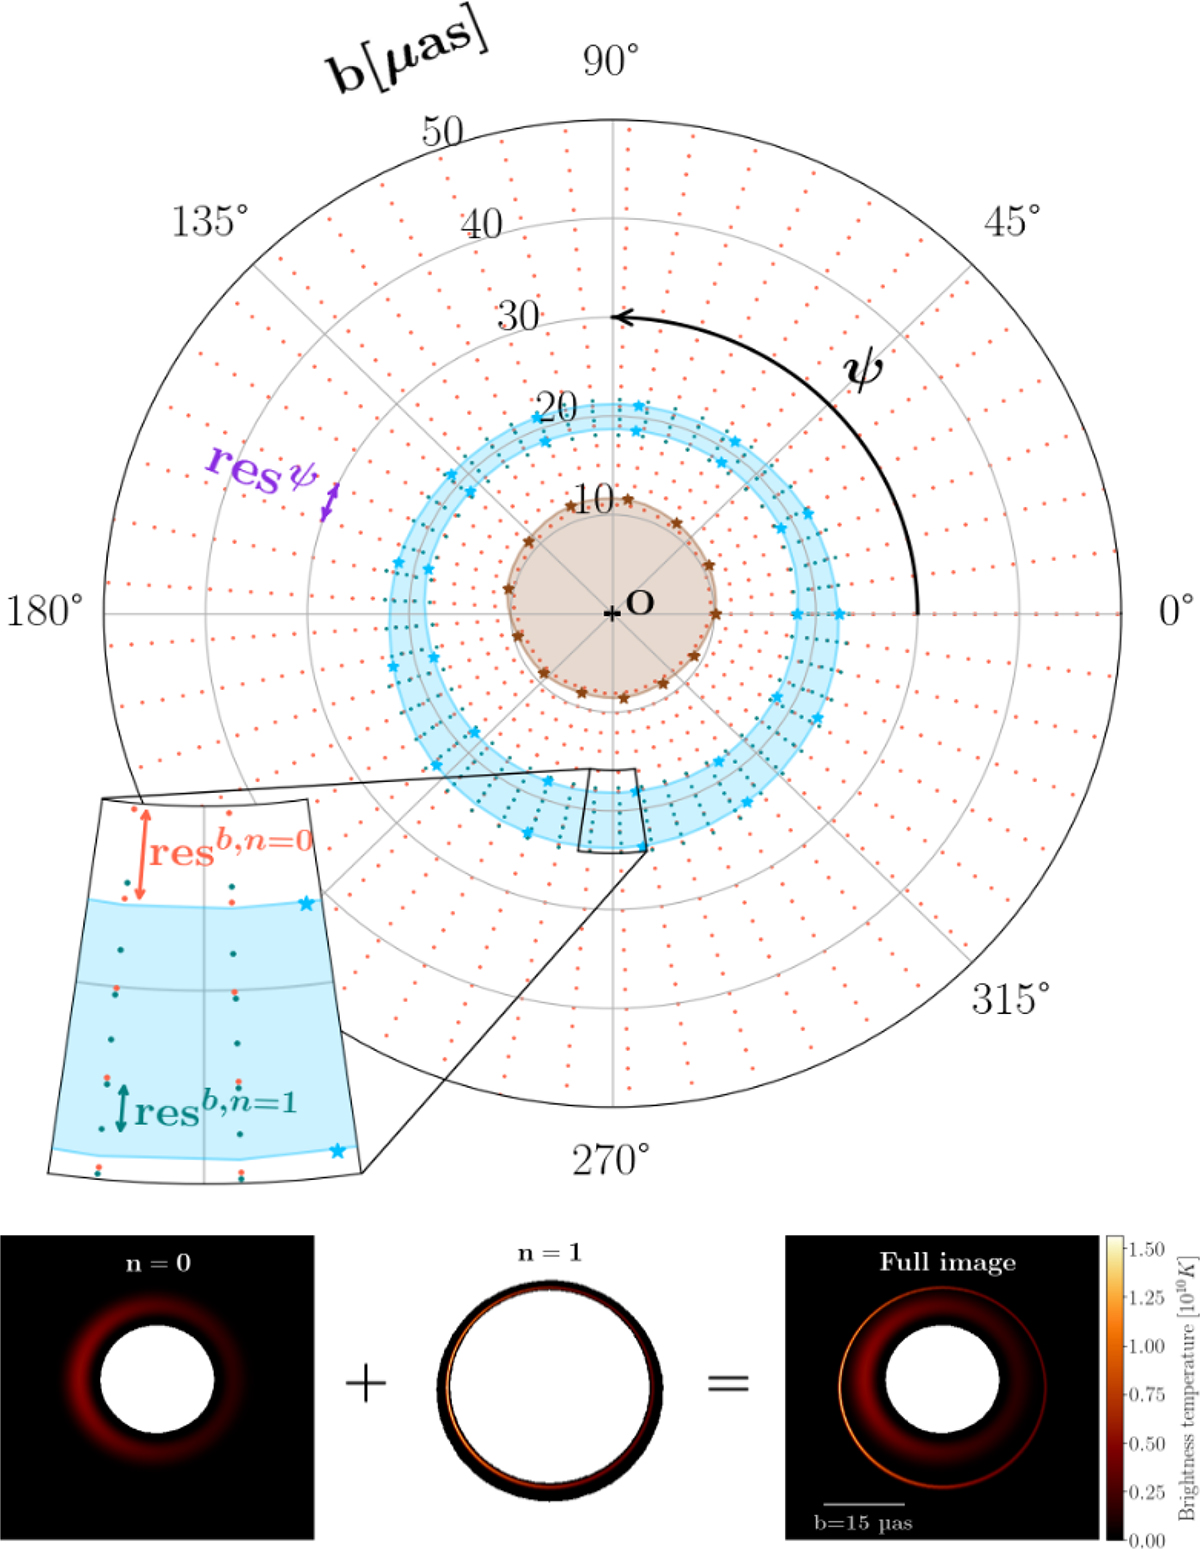
Fig. 4.
Download original image
Adaptative ray-tracing polar grid with point densities adjusted for visual purposes. The real resolution values used in the simulated images are: angular resolution resψ = 3.6° (violet), n = 0 radial resolution resb, n = 0 = 0.05 μas (orange) outside the inner shadow (brown), n = 1 radial resolution resb, n = 1 = 0.005 μas (teal) in its lensing band (light blue). The star symbols represent the computed points of the apparent horizon and of the edges of the n = 1 lensing band before interpolation. The inner 30 μas of a mean-profile sample images are also shown.
Current usage metrics show cumulative count of Article Views (full-text article views including HTML views, PDF and ePub downloads, according to the available data) and Abstracts Views on Vision4Press platform.
Data correspond to usage on the plateform after 2015. The current usage metrics is available 48-96 hours after online publication and is updated daily on week days.
Initial download of the metrics may take a while.