Fig. 11
Download original image
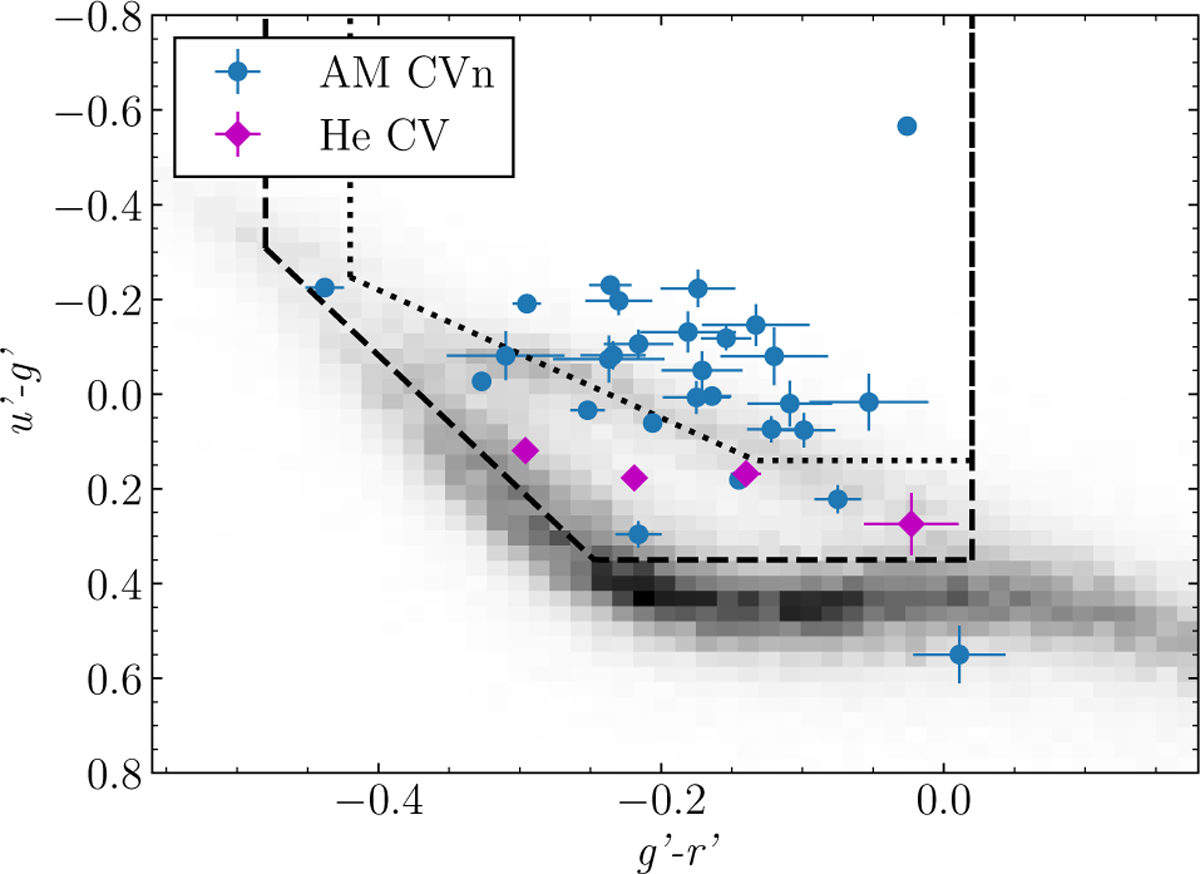
Colour-colour plot of targets in this sample with SDSS u′g′r′ colours and g′ < 20.5. A further four points (two AMCVn-type and two He CVs) are not shown because they would be outside the panel. The grey two-dimensional histogram shows the distribution of a sample of white dwarfs (Gentile Fusillo et al. 2021). The black dotted line shows the original colour–colour selection box of Roelofs et al. (2009), and the black dashed line shows the updated selection criteria of Carter et al. (2014a). A number of mass-transferring UCBs are missed by the older selection criteria but selected by the newer criteria.
Current usage metrics show cumulative count of Article Views (full-text article views including HTML views, PDF and ePub downloads, according to the available data) and Abstracts Views on Vision4Press platform.
Data correspond to usage on the plateform after 2015. The current usage metrics is available 48-96 hours after online publication and is updated daily on week days.
Initial download of the metrics may take a while.