Fig. 3.
Download original image
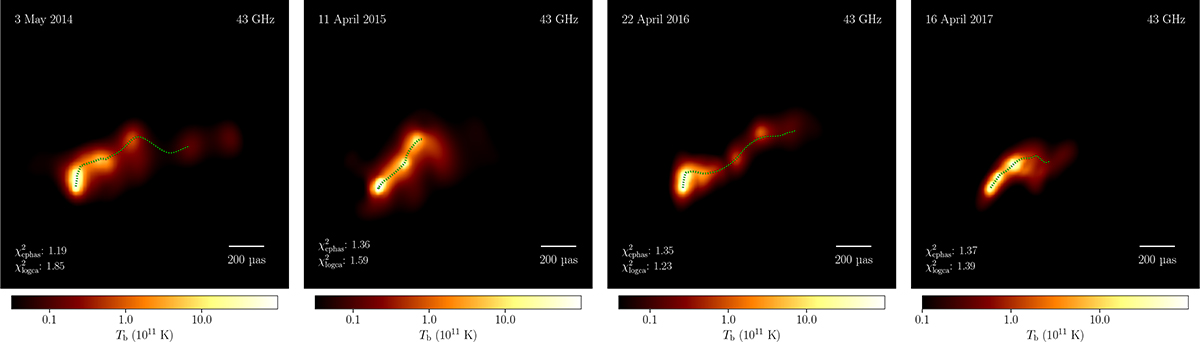
Multi-epoch 43 GHz VLBI images of OJ 287 observed on May 3, 2014, April 11, 2015, April 22, 2016, and April 16, 2017. Each panel shows the source morphology in total intensity as reconstructed by ehtim. The color scale is the same for all days and is in units of brightness temperature; an angular scale indicator is included in the bottom-right corner of each image (200 μas) for reference. The χ2 statistics used as diagnostics of the model fit quality – the closure phase reduced χ2 (χcphase2) and the logarithmic closure amplitude reduced χ2 (χlogamp2) – are displayed in the bottom-left corner of each image. The ridgelines, delineating the jet’s axis for each epoch, are overlaid as dashed lime lines, with a black outline for enhanced visibility. In this image sequence we can clearly see the jet’s remarkable PA evolution over the four years.
Current usage metrics show cumulative count of Article Views (full-text article views including HTML views, PDF and ePub downloads, according to the available data) and Abstracts Views on Vision4Press platform.
Data correspond to usage on the plateform after 2015. The current usage metrics is available 48-96 hours after online publication and is updated daily on week days.
Initial download of the metrics may take a while.