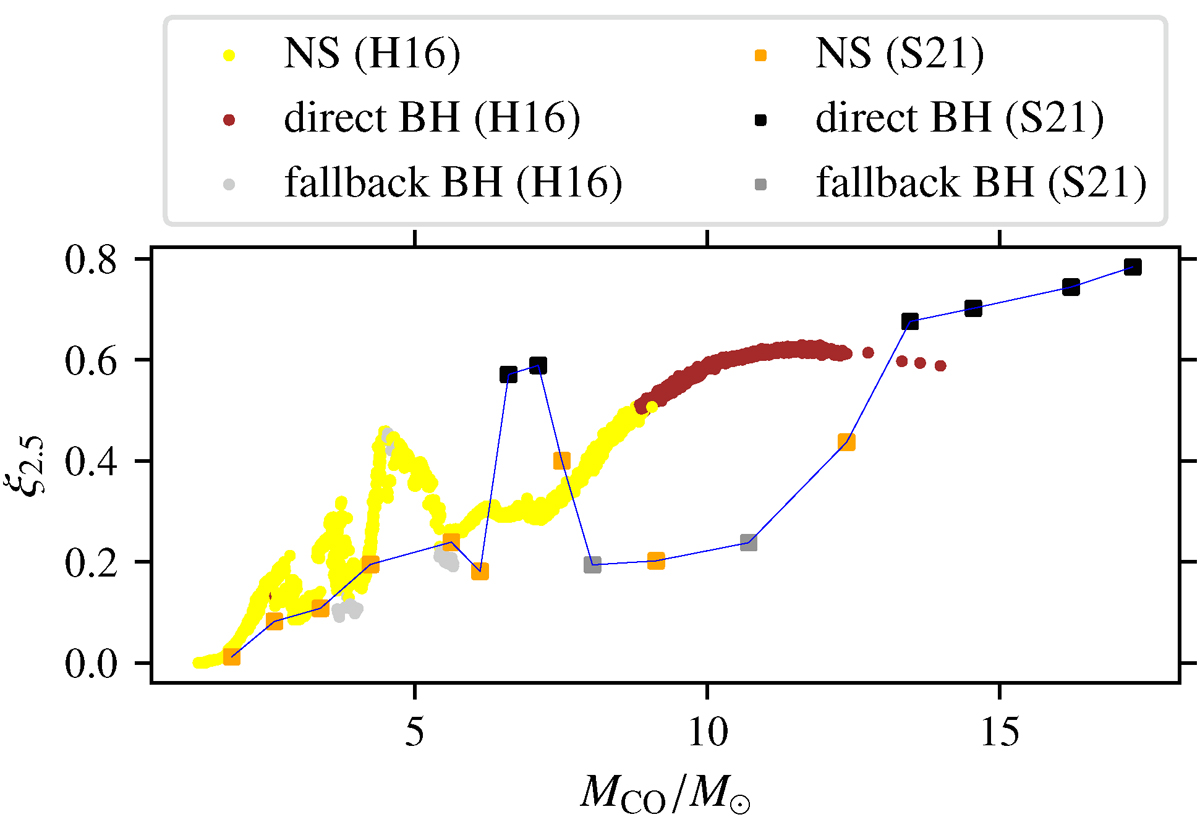
Fig. A.6.
Download original image
Compact remnants left behind the Z⊙ single star SN progenitor models S21 and H16, predicted by the M16 SN model, are compared with the trends of progenitor ξ2.5 with MCO. The ξ2.5–peaks are shifted towards higher MCO in S21 compared to H16. The peaks are at ≃4.8 M⊙ in H16 but at ≃7 M⊙ in S21, and at ≃9 M⊙ in H16 but at ≃13 M⊙ in S21. For improved visual discrimination, the sparsely sampled S21 models are connected by lines (in blue).
Current usage metrics show cumulative count of Article Views (full-text article views including HTML views, PDF and ePub downloads, according to the available data) and Abstracts Views on Vision4Press platform.
Data correspond to usage on the plateform after 2015. The current usage metrics is available 48-96 hours after online publication and is updated daily on week days.
Initial download of the metrics may take a while.