Fig. 7.
Download original image
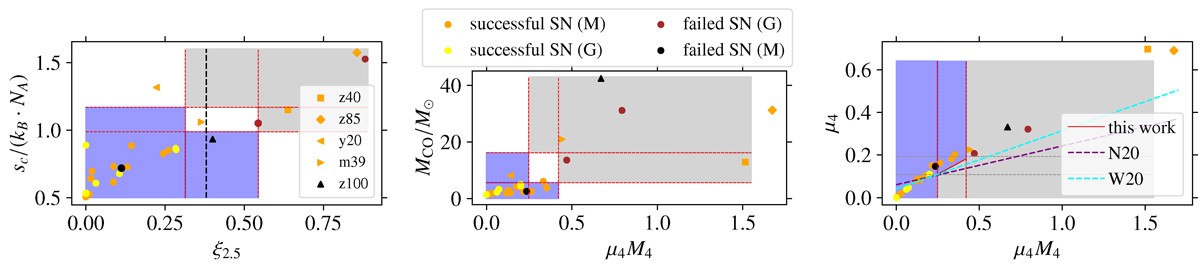
Comparison of the final fate predictions using our pre-SN explodability criteria to 3D CCSN simulation outcomes performed in the Garching (G) and Monash (M) groups. The dashed red lines in the two-parameter planes spanned by (ξ2.5, sc) and by (μ4M4, MCO) – in the left and the central panel, respectively – indicate the lower and upper thresholds of each explodability proxy used in our pre-SN criteria. In the left panel, the dashed black line shows the explodability classification based on the ξ2.5crit = 0.38 threshold. In the right panel, the separation line for the final fate classification in the (μ4M4, μ4) plane by the reversed E16 criterion introduced in this work is shown by a red line, and compared to the standard E16 criterion, with calibrations from Ertl et al. (2020) for the updated W20 and N20 models (dashed lines in cyan and purple). The 3D CCSN simulation outcomes are color-coded in yellow (Garching) and orange (Monash) for the exploding progenitors, and in brown (Garching) and black (Monash) for the non-exploding progenitors. Specific progenitors that are referenced in the main text are represented by symbols other than circles. The background color shows the final fate assignment using our explodability proxies: failed SN (in grey), successful SN (in blue) and unclassified (blank) regions of their value spaces.
Current usage metrics show cumulative count of Article Views (full-text article views including HTML views, PDF and ePub downloads, according to the available data) and Abstracts Views on Vision4Press platform.
Data correspond to usage on the plateform after 2015. The current usage metrics is available 48-96 hours after online publication and is updated daily on week days.
Initial download of the metrics may take a while.