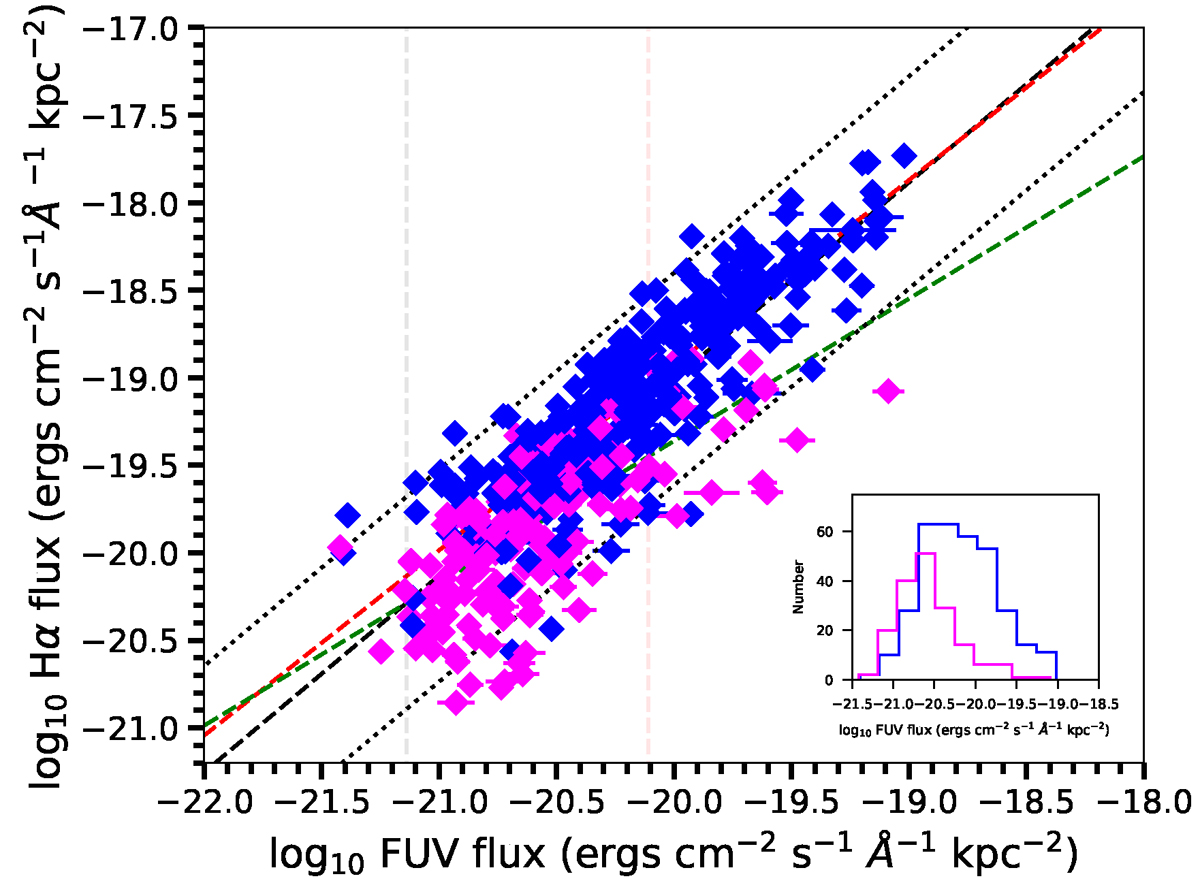
Fig. 2.
Download original image
Far-ultraviolet flux density of the segments detected for 13 galaxies is compared with the Hα flux density. The segments from the disc of the galaxy are shown in blue points and the segments from tails are shown with magenta points. The relation between FUV and Hα flux density values of the segments, computed by linear regression, is shown with a black dashed line, with a one-sigma width on each side of the relation indicated by black dotted lines. The relation computed for disc segments are shown in red and the tail segments in green. The FUV limiting flux computed from the full field UVIT imaging of galaxy with highest integration time (JW56) is shown in das black vertical line and for the galaxy with lowest integration time (JO134) is shown in dash red vertical line. The histogram of the FUV flux density of the segments detected from tail and disc of galaxies are shown in the subplot.
Current usage metrics show cumulative count of Article Views (full-text article views including HTML views, PDF and ePub downloads, according to the available data) and Abstracts Views on Vision4Press platform.
Data correspond to usage on the plateform after 2015. The current usage metrics is available 48-96 hours after online publication and is updated daily on week days.
Initial download of the metrics may take a while.