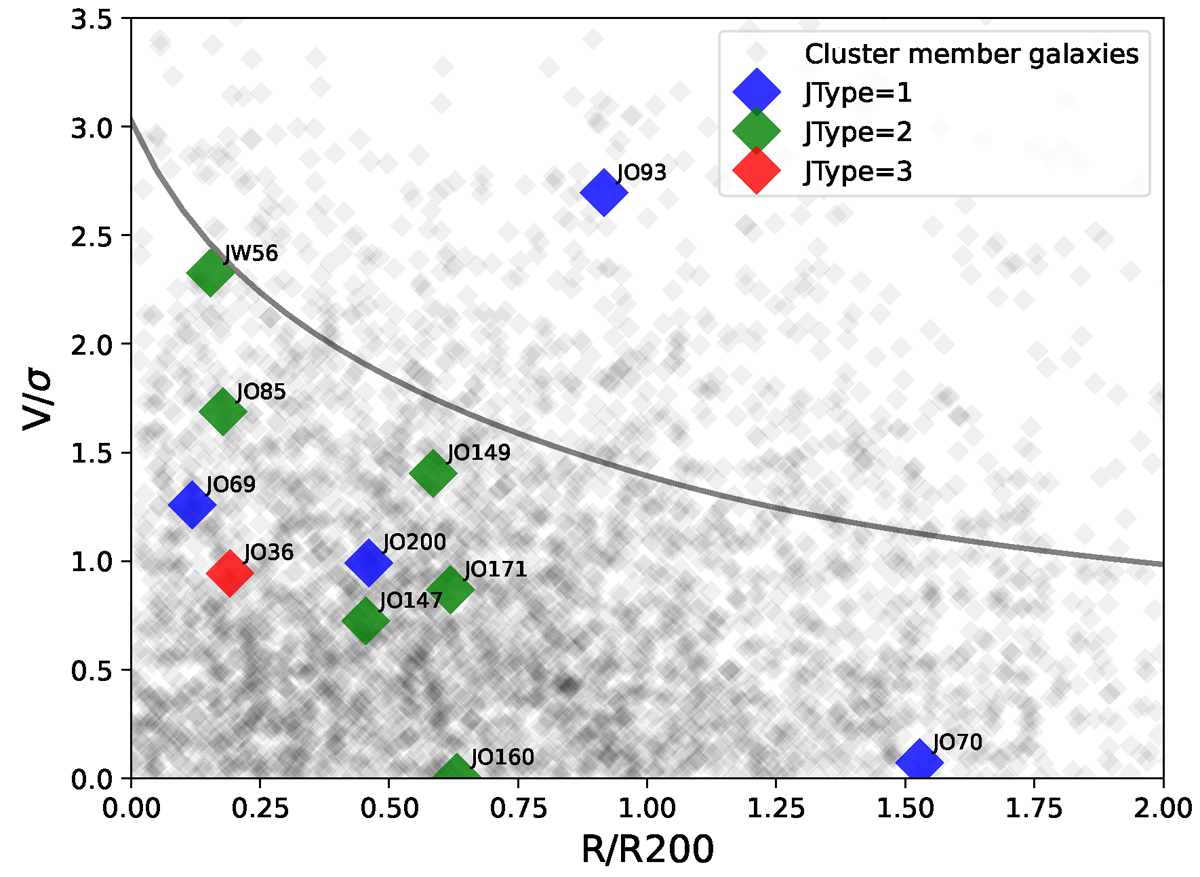
Fig. 5.
Download original image
Phase space diagram for 11 jellyfish galaxies is shown with coloured diamond points. We group the galaxies with JType and assign the GASP name of the galaxies to the corresponding points in the plot. Member galaxies in ten galaxy clusters are shown with grey colour diamond points. The normalised, projected distance from the cluster centre (in units of R200) against the galaxy line-of-sight velocities with respect to the cluster mean, also normalised to cluster velocity dispersion. The three-dimensional (unprojected) escape velocity in an NFW halo with concentration c = 6 is shown by the grey curve for reference.
Current usage metrics show cumulative count of Article Views (full-text article views including HTML views, PDF and ePub downloads, according to the available data) and Abstracts Views on Vision4Press platform.
Data correspond to usage on the plateform after 2015. The current usage metrics is available 48-96 hours after online publication and is updated daily on week days.
Initial download of the metrics may take a while.