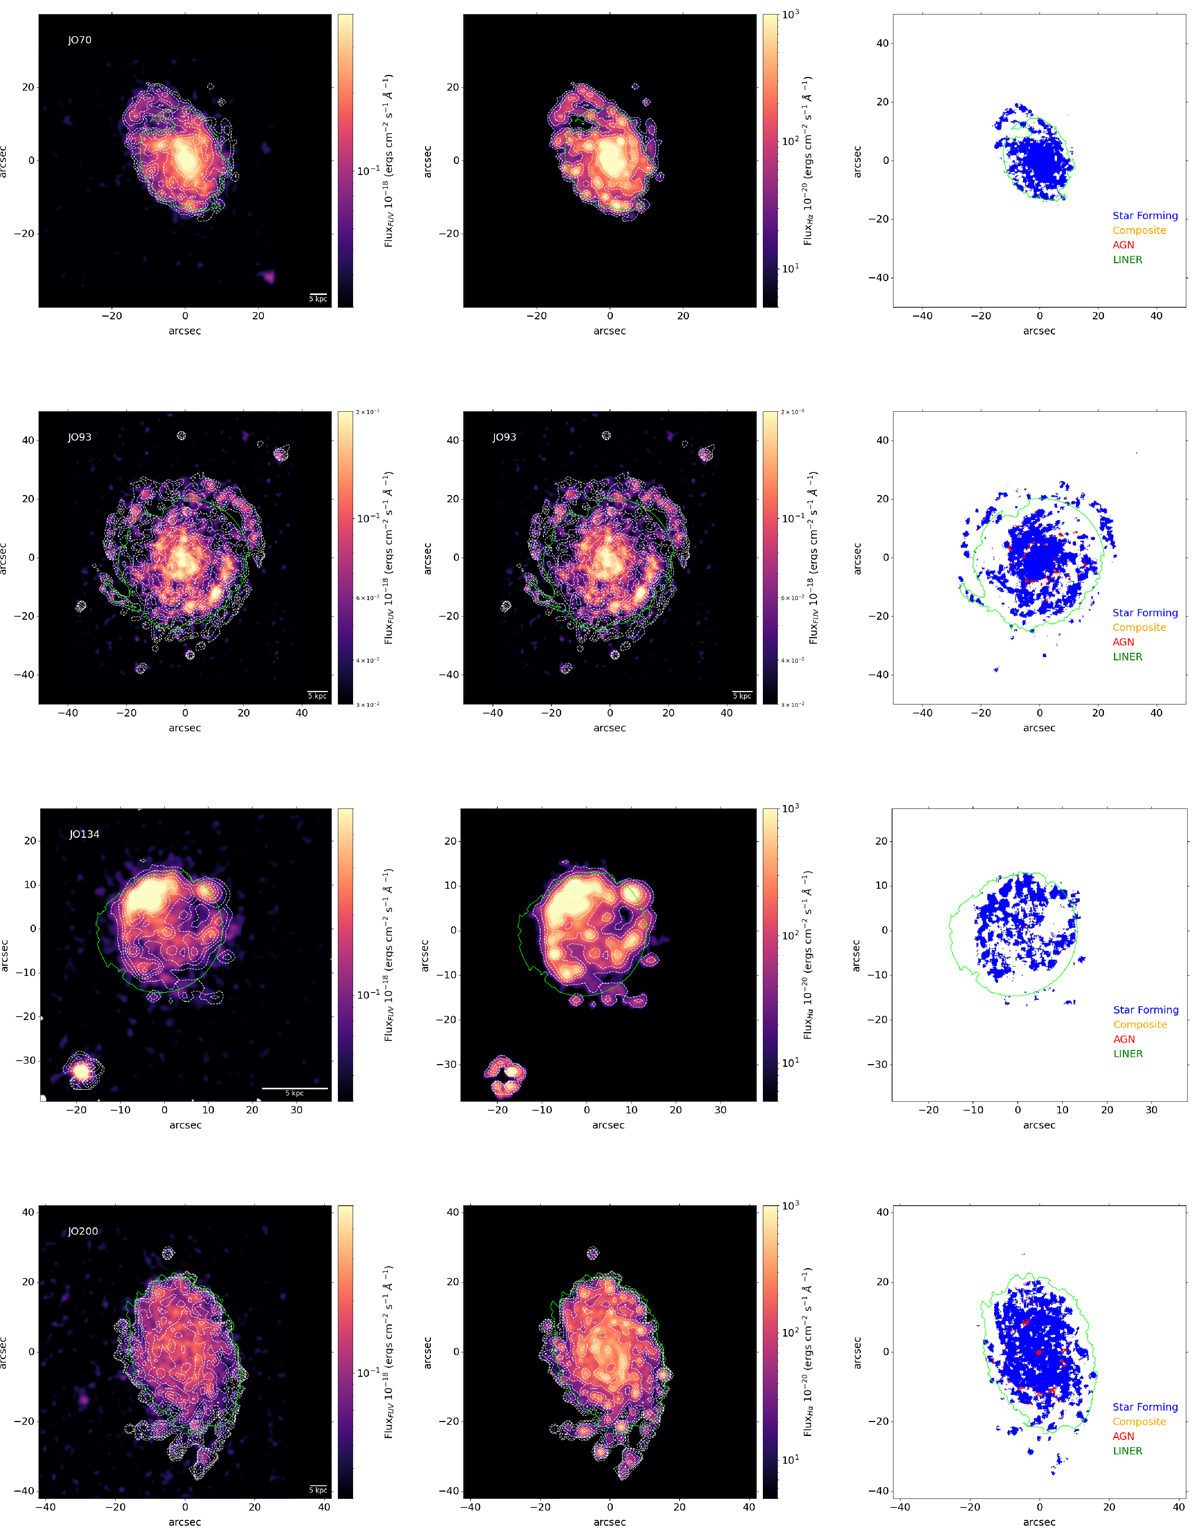
Fig. A.3.
Download original image
Far-ultraviolet, Hα flux image, and emission line diagnostic map of galaxies. The Hα flux contours in white colour are overlaid over FUV and Hα images. The green line defines the galaxy’s main body. Regions covered due to emission from LINER, composite (AGN+SF) and star formation are assigned with different colours in the emission line map.
Current usage metrics show cumulative count of Article Views (full-text article views including HTML views, PDF and ePub downloads, according to the available data) and Abstracts Views on Vision4Press platform.
Data correspond to usage on the plateform after 2015. The current usage metrics is available 48-96 hours after online publication and is updated daily on week days.
Initial download of the metrics may take a while.