Fig. E.1
Download original image
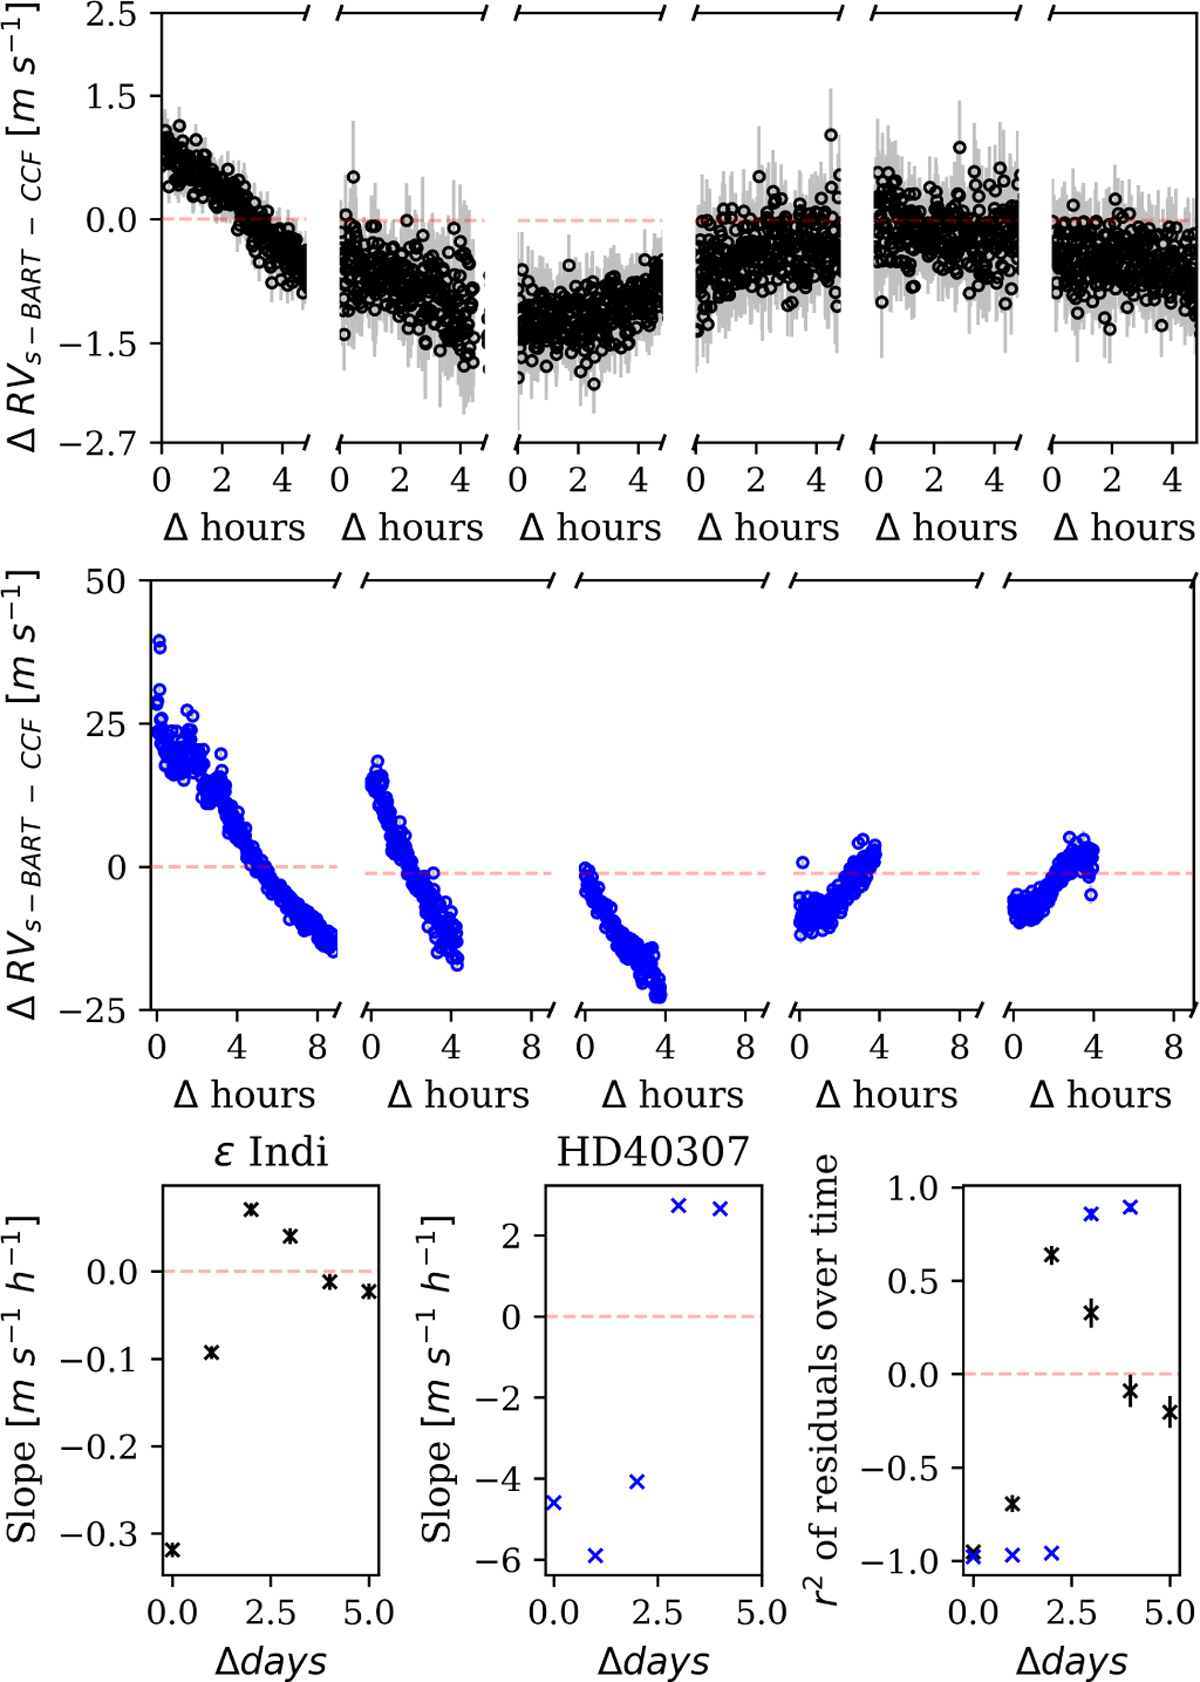
RV residuals between s-BART and CCF RVs for the ESPRESSO observations of Indi (in black, top row) and HD40307 (in blue, middle row), divided in the different consecutive nights. The data from the first night of observations was used to construct the stellar template that was then applied to the other nights. Bottom row: Slope of a first degree polynomial that fitted to the RV residuals of Indi (left) and HD40307 (middle). The right-most column presents the Pearson correlation coefficient of the residuals over time, with the error bars representing a 90% confidence interval.
Current usage metrics show cumulative count of Article Views (full-text article views including HTML views, PDF and ePub downloads, according to the available data) and Abstracts Views on Vision4Press platform.
Data correspond to usage on the plateform after 2015. The current usage metrics is available 48-96 hours after online publication and is updated daily on week days.
Initial download of the metrics may take a while.