Fig. 2
Download original image
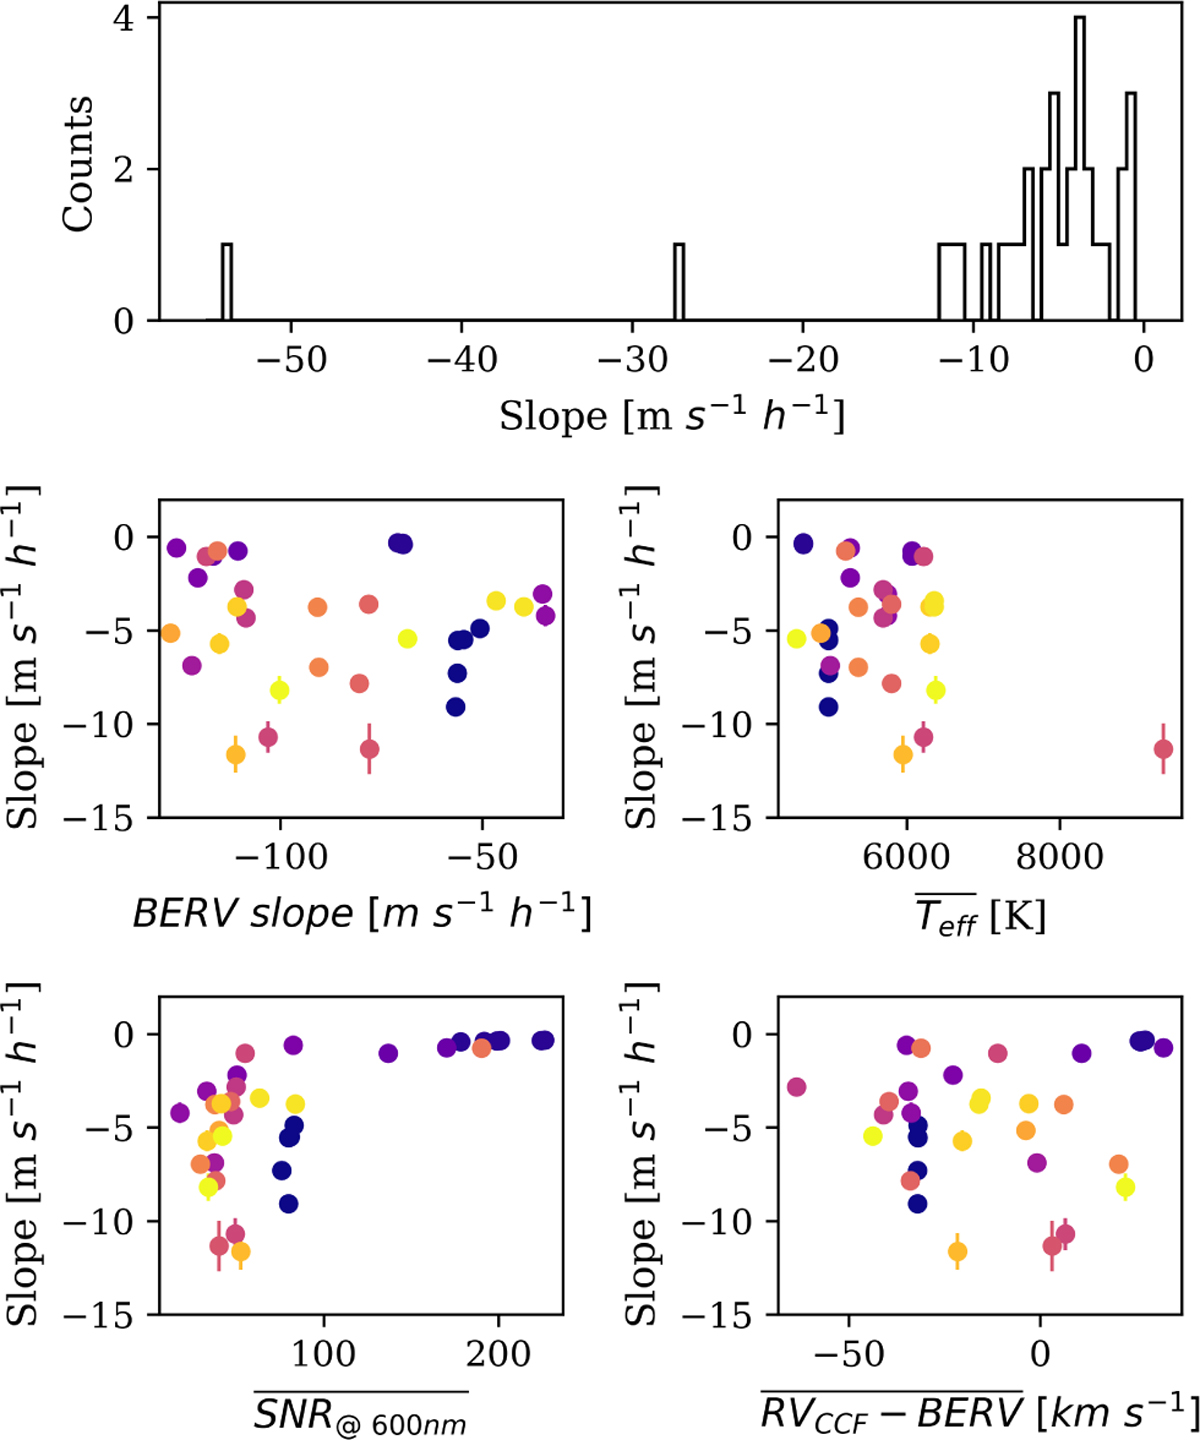
RV bias for 3785 ESPRESSO observations of 20 different stars. The top row presents an histogram of the slopes of a first degree polynomial that was adjusted to the residuals between s-BART and CCF RVs. The bottom two rows present a scatter plot with the median value of different metrics: intra-night slope of BERV variation, effective temperature, median S/N at 600 nm, and median difference between CCF RV and BERV. All observation nights of the same star are shown with a common color. For representation purposes we do not show the two outliers (with a slope greater than −20 ms−1 h−1 ) in the correlation plots.
Current usage metrics show cumulative count of Article Views (full-text article views including HTML views, PDF and ePub downloads, according to the available data) and Abstracts Views on Vision4Press platform.
Data correspond to usage on the plateform after 2015. The current usage metrics is available 48-96 hours after online publication and is updated daily on week days.
Initial download of the metrics may take a while.