Fig. 4
Download original image
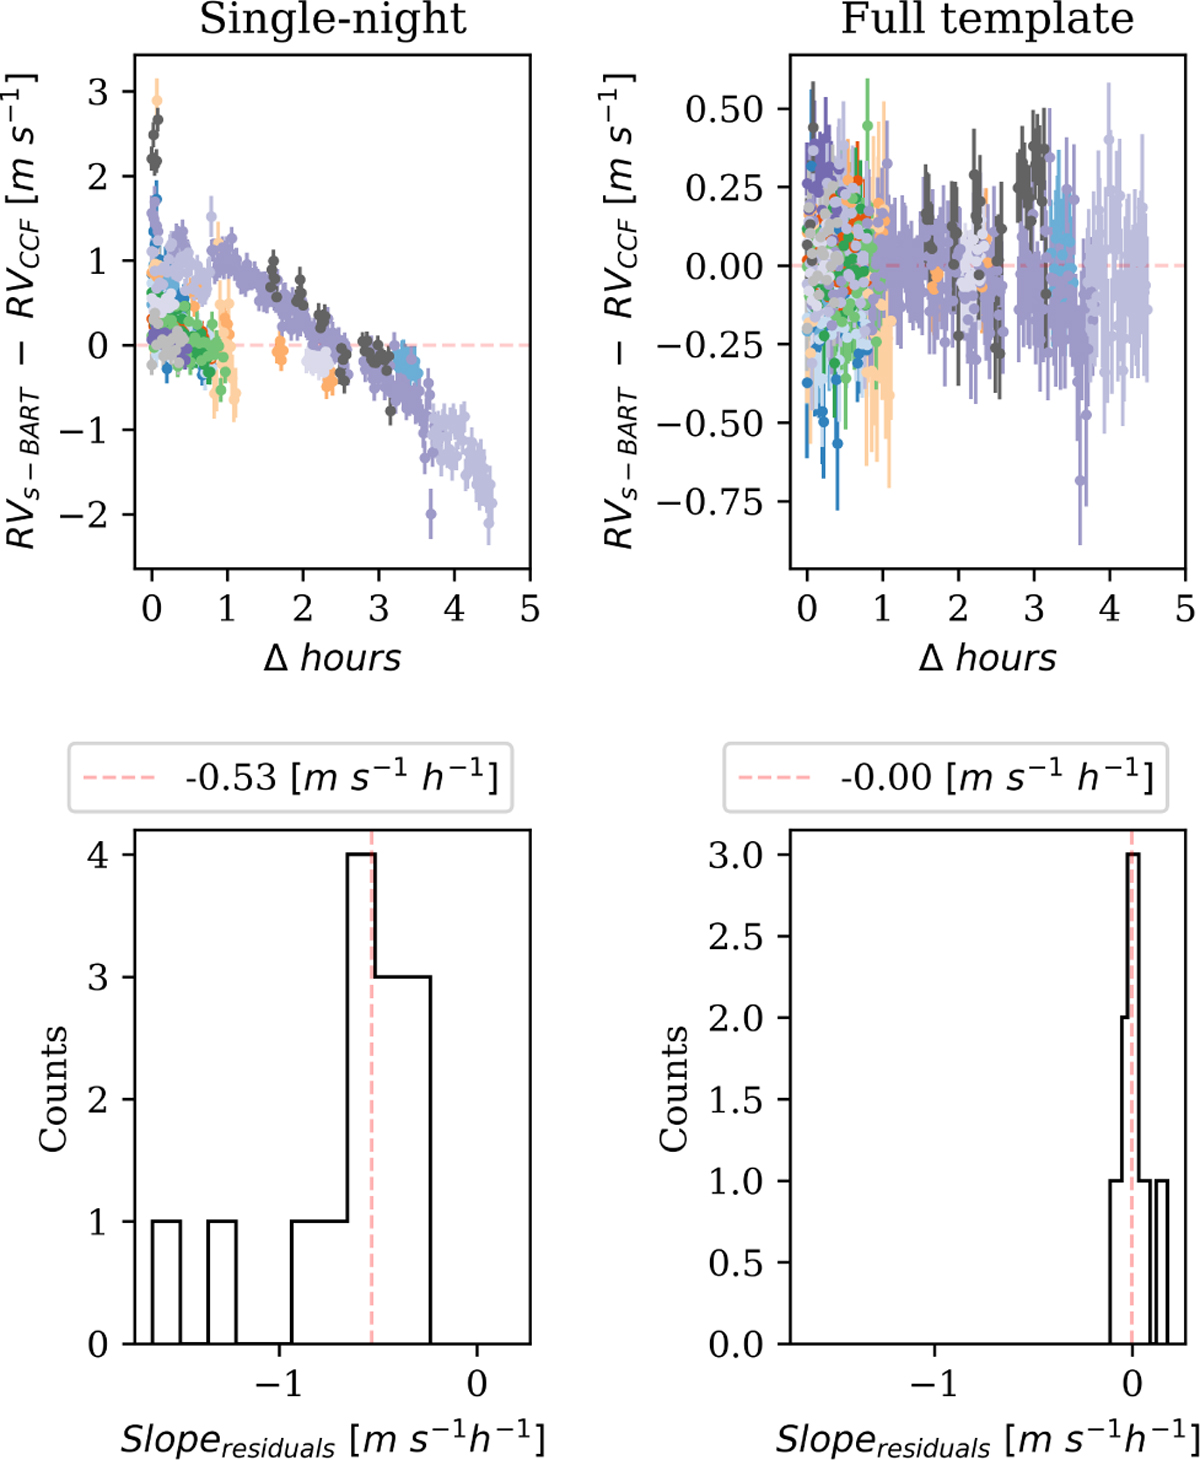
Top: residuals between s-BART RVs and CCF RVs of τ Ceti when using the template constructed from a single night (left) and the one constructed from all available observations (right). Each night is represented by a unique color in the two time series. Bottom: histogram of the slopes of the first-degree polynomials adjusted to the residuals of the corresponding column.
Current usage metrics show cumulative count of Article Views (full-text article views including HTML views, PDF and ePub downloads, according to the available data) and Abstracts Views on Vision4Press platform.
Data correspond to usage on the plateform after 2015. The current usage metrics is available 48-96 hours after online publication and is updated daily on week days.
Initial download of the metrics may take a while.