Fig. 6
Download original image
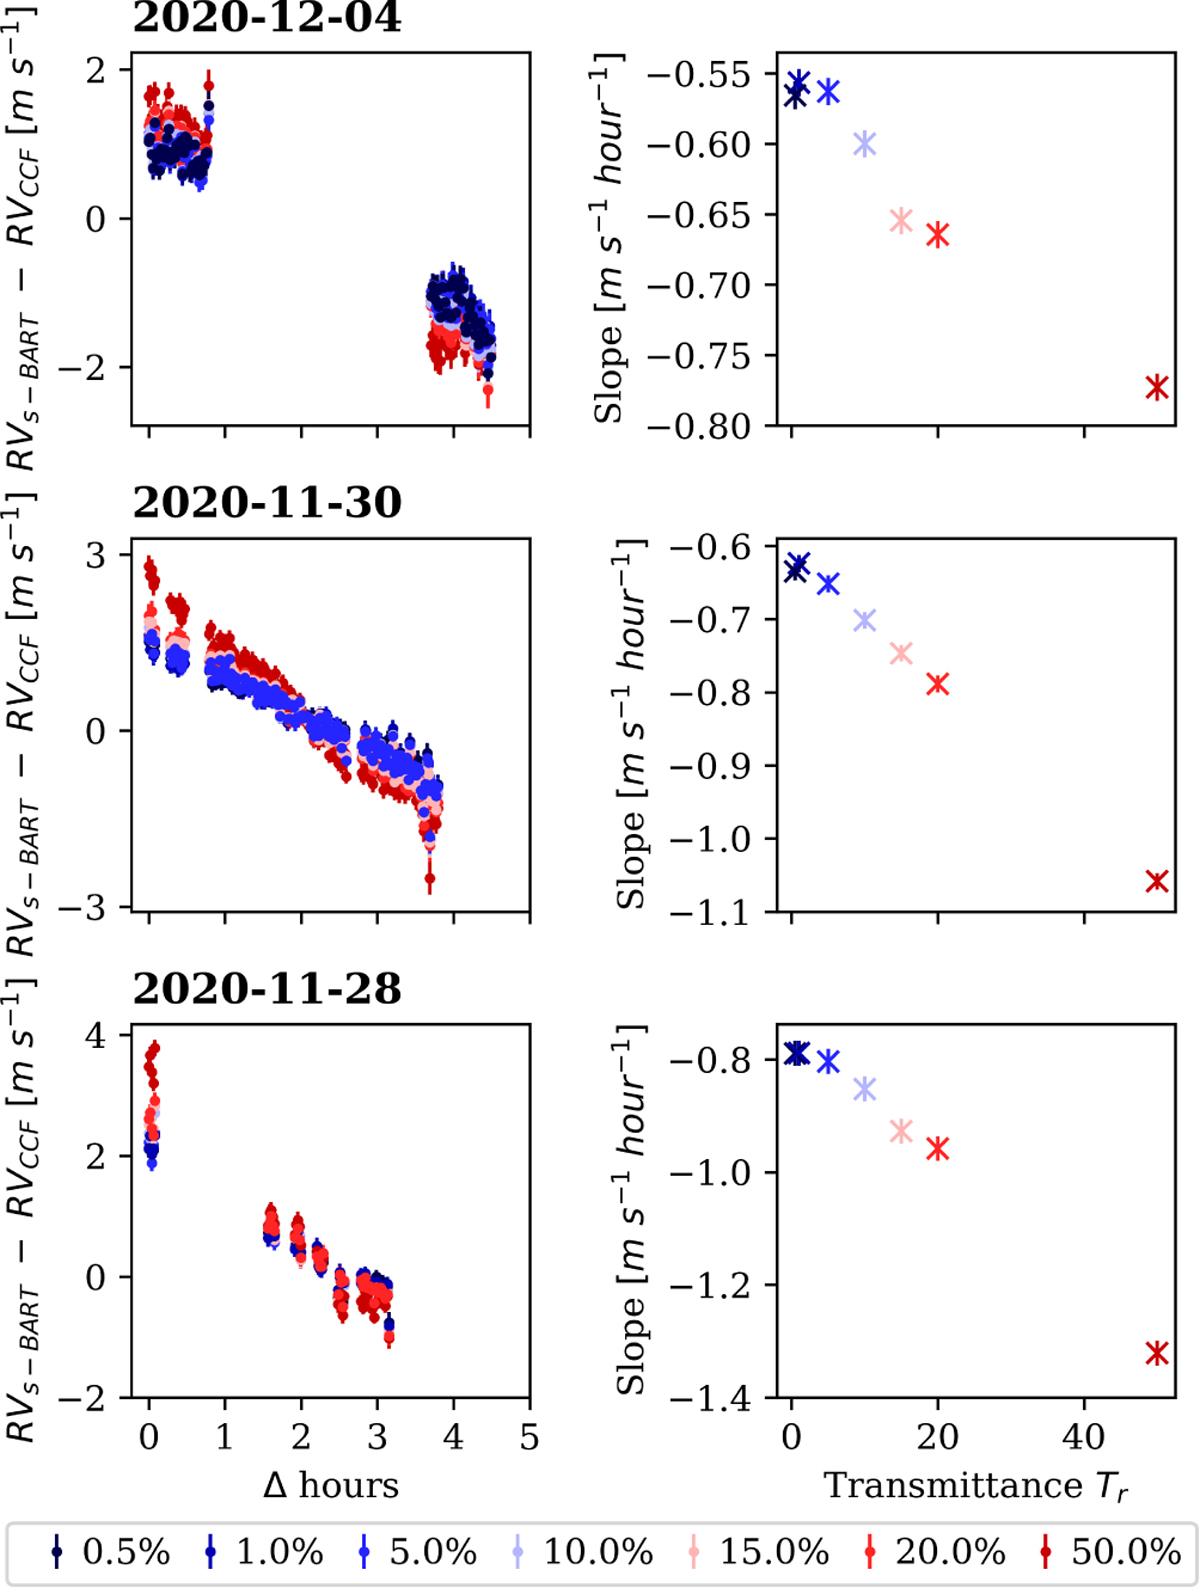
Impact on the RV trend from template matching after creating a telluric mask with different thresholds for the rejection of telluric-contaminated regions. The thresholds were applied to the same transmittance spectrum, generated through Telfit (Gullikson et al. 2014). Each row represents different nights of τ Ceti, chosen from within our subset specified in Table A.2. Left: residuals to the CCF RVs, color-coded based on the transmittance threshold; Right: slope of a first-degree polynomial adjusted to the residuals as a function of the transmittance threshold.
Current usage metrics show cumulative count of Article Views (full-text article views including HTML views, PDF and ePub downloads, according to the available data) and Abstracts Views on Vision4Press platform.
Data correspond to usage on the plateform after 2015. The current usage metrics is available 48-96 hours after online publication and is updated daily on week days.
Initial download of the metrics may take a while.