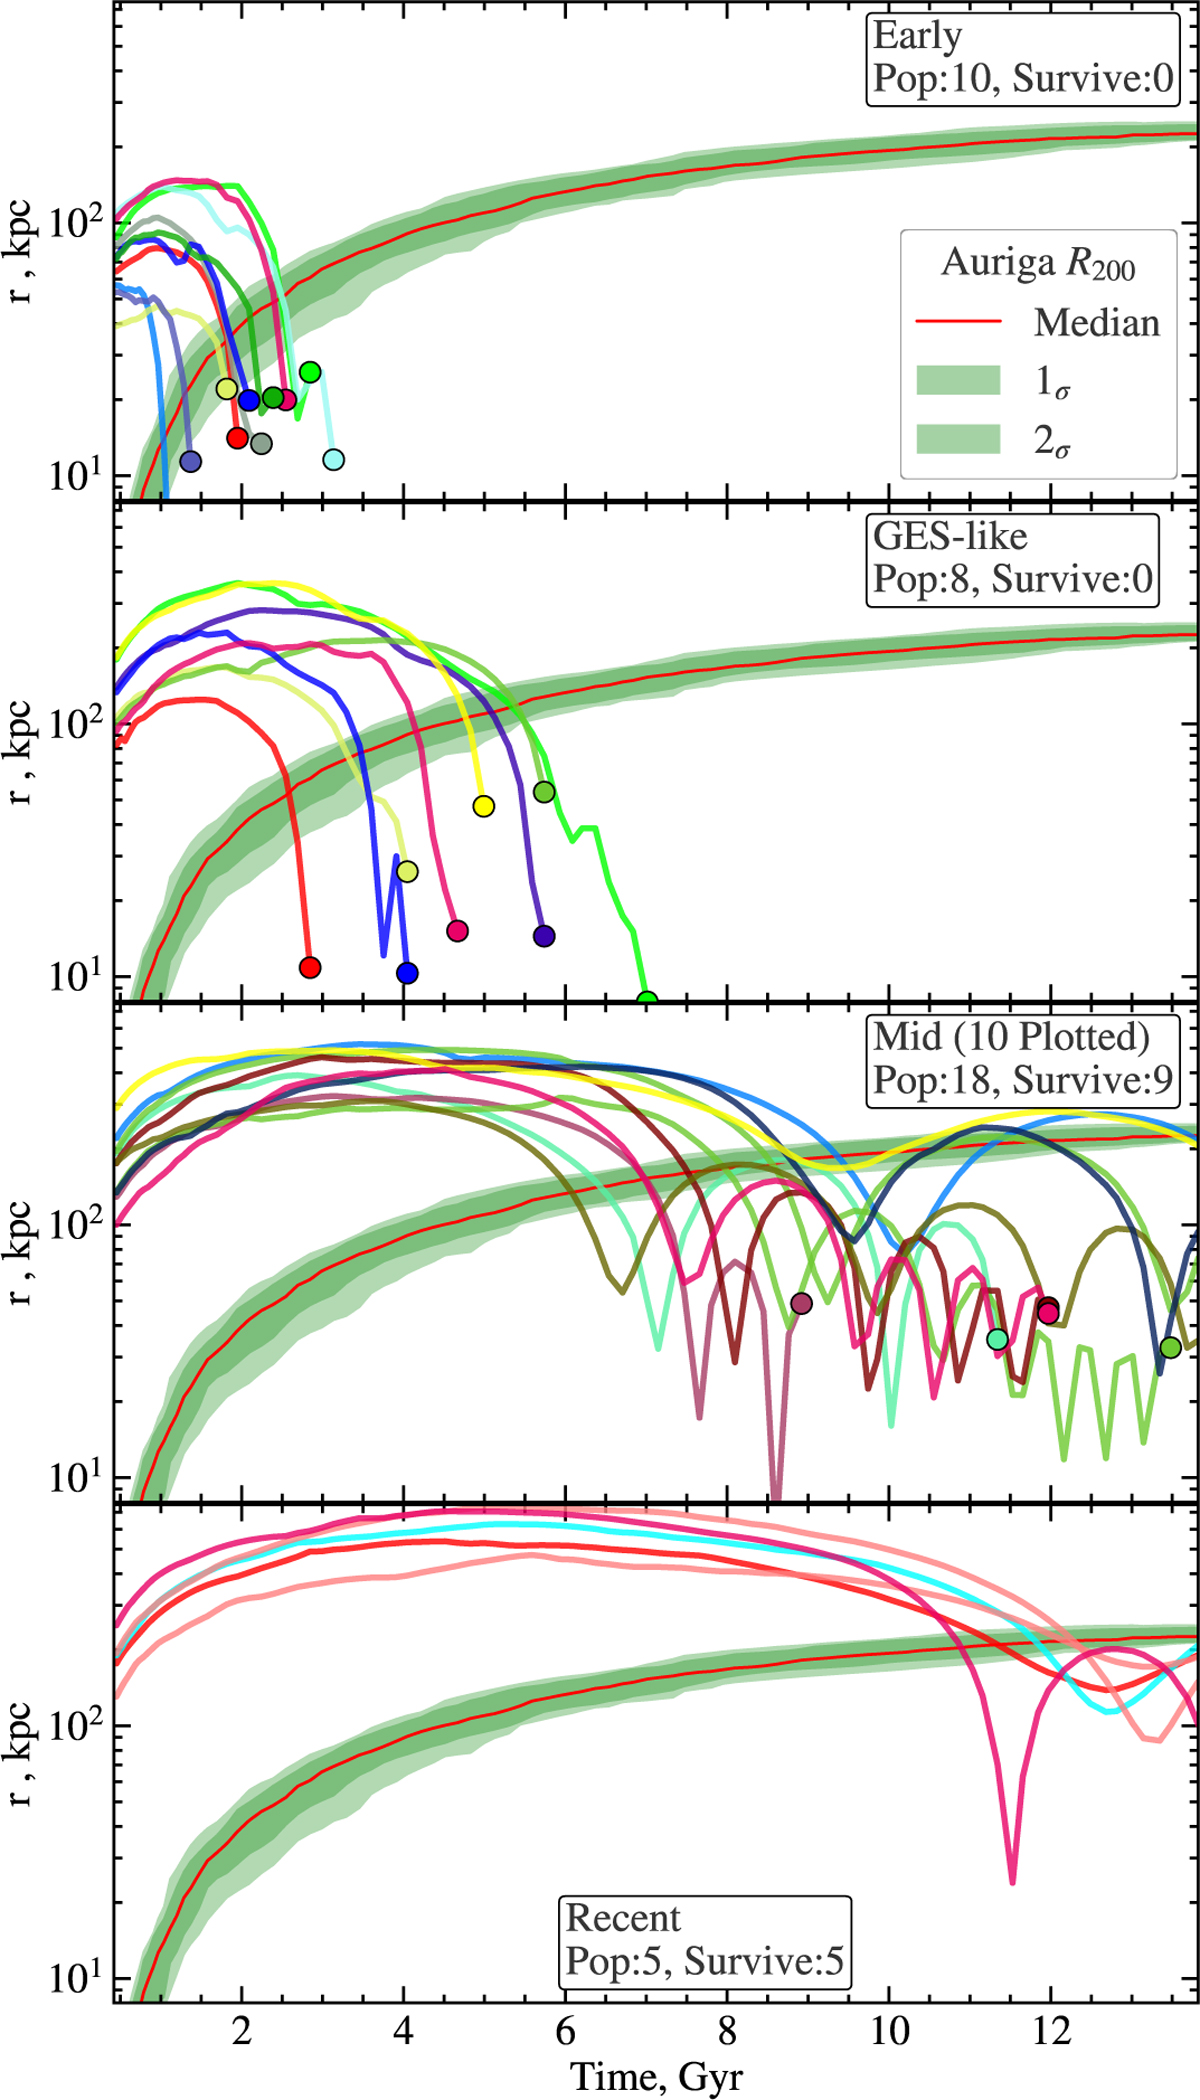
Fig. A.1
Download original image
Examples of the infall of our selection accretion events across the Auriga halo sample. The different panels depict our different analogue selections, whose radial orbits against time are shown by the solid coloured lines. The point at which the subhalo was destroyed, and cannot be found in the merger trees, is given by the scatter points. The red line shows the median R200 of our Auriga haloes, with the 1σ and 2σ percentile ranges of the sample shown with green shading.
Current usage metrics show cumulative count of Article Views (full-text article views including HTML views, PDF and ePub downloads, according to the available data) and Abstracts Views on Vision4Press platform.
Data correspond to usage on the plateform after 2015. The current usage metrics is available 48-96 hours after online publication and is updated daily on week days.
Initial download of the metrics may take a while.