Fig. B.1
Download original image
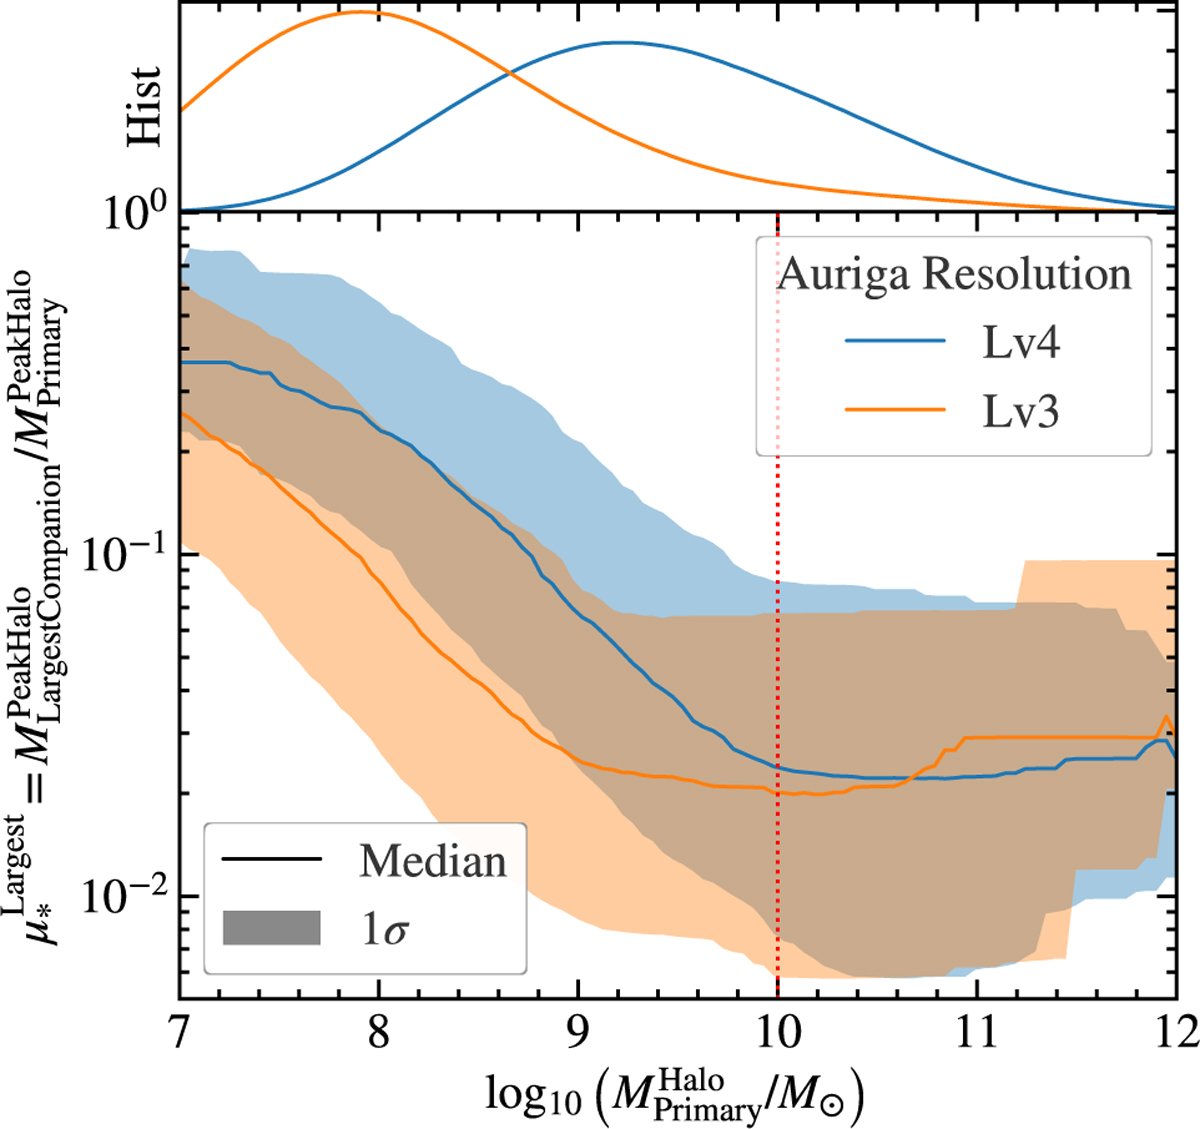
Mass fraction of the largest companion and the primary satellite, as a function of the primary satellite’s mass. Here we use the entire sample of group infall events for the Auriga level-4 resolution sample (in blue), and the smaller Auriga level-3 sample (in orange). The solid lines correspond to the median of the samples binned by the primary satellite’s mass, and the shaded regions are the 1σ ranges given by the 16 − 84% percentile range. The additional top panel depicts the normalised histogram of the primary accretion events’ mass.
Current usage metrics show cumulative count of Article Views (full-text article views including HTML views, PDF and ePub downloads, according to the available data) and Abstracts Views on Vision4Press platform.
Data correspond to usage on the plateform after 2015. The current usage metrics is available 48-96 hours after online publication and is updated daily on week days.
Initial download of the metrics may take a while.