Fig. 4
Download original image
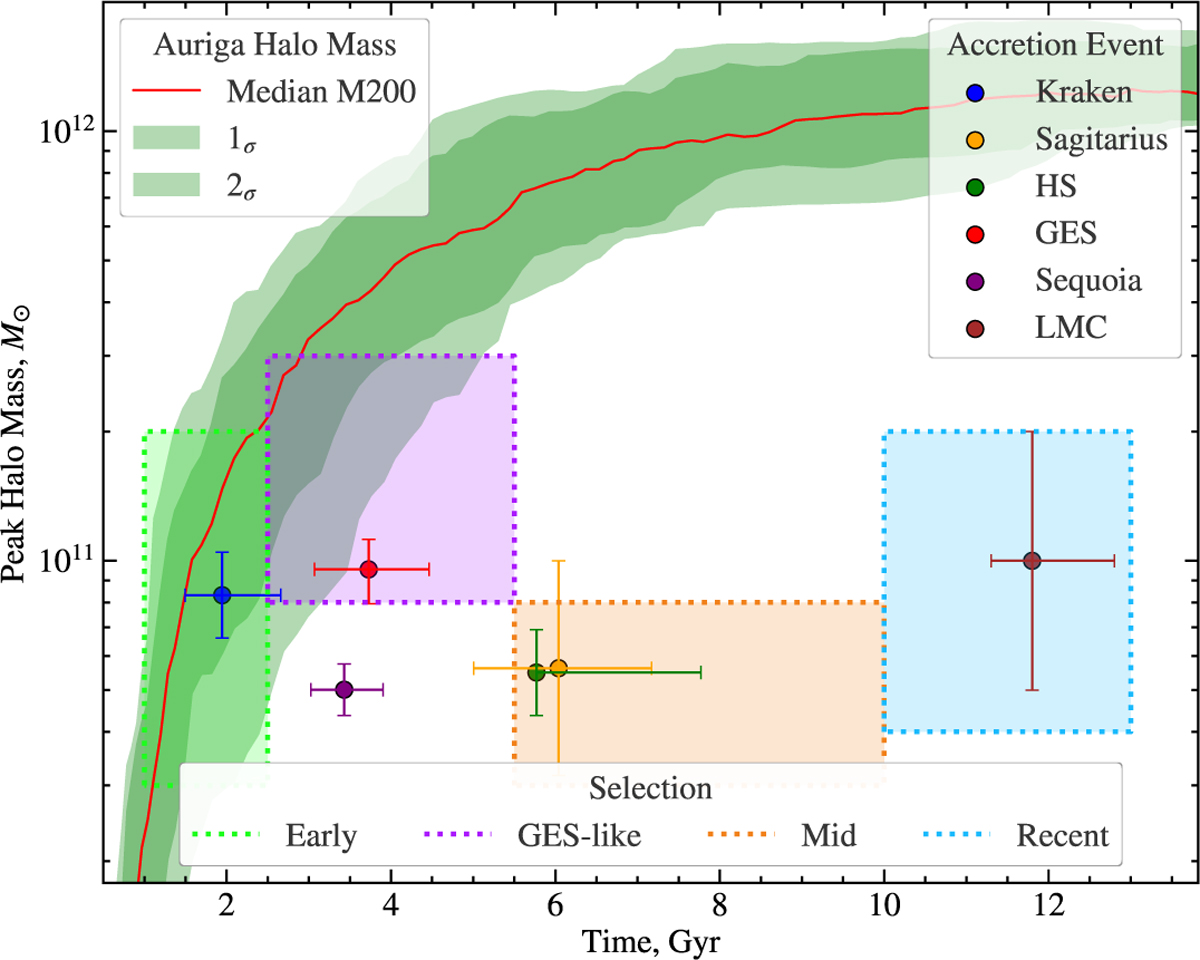
Accretion history of an ‘average’ MW, in the space of lookback time and peak halo mass. We have marked some important events in the accretion history of the MW known to date, with scatter points and uncertainties based on values from the literature (see Sect. 3.1 for details). These represent regions of interest in this space, chosen to capture the characteristics of some of the key accretion events, with four selections in Table 1. The red line is the median M200 mass of the main halo across the level-4 AURIGA simulations against time, with green shaded regions indicating the 1σ and 2σ spreads (defined as the 18–84% and 5–95% ranges).
Current usage metrics show cumulative count of Article Views (full-text article views including HTML views, PDF and ePub downloads, according to the available data) and Abstracts Views on Vision4Press platform.
Data correspond to usage on the plateform after 2015. The current usage metrics is available 48-96 hours after online publication and is updated daily on week days.
Initial download of the metrics may take a while.