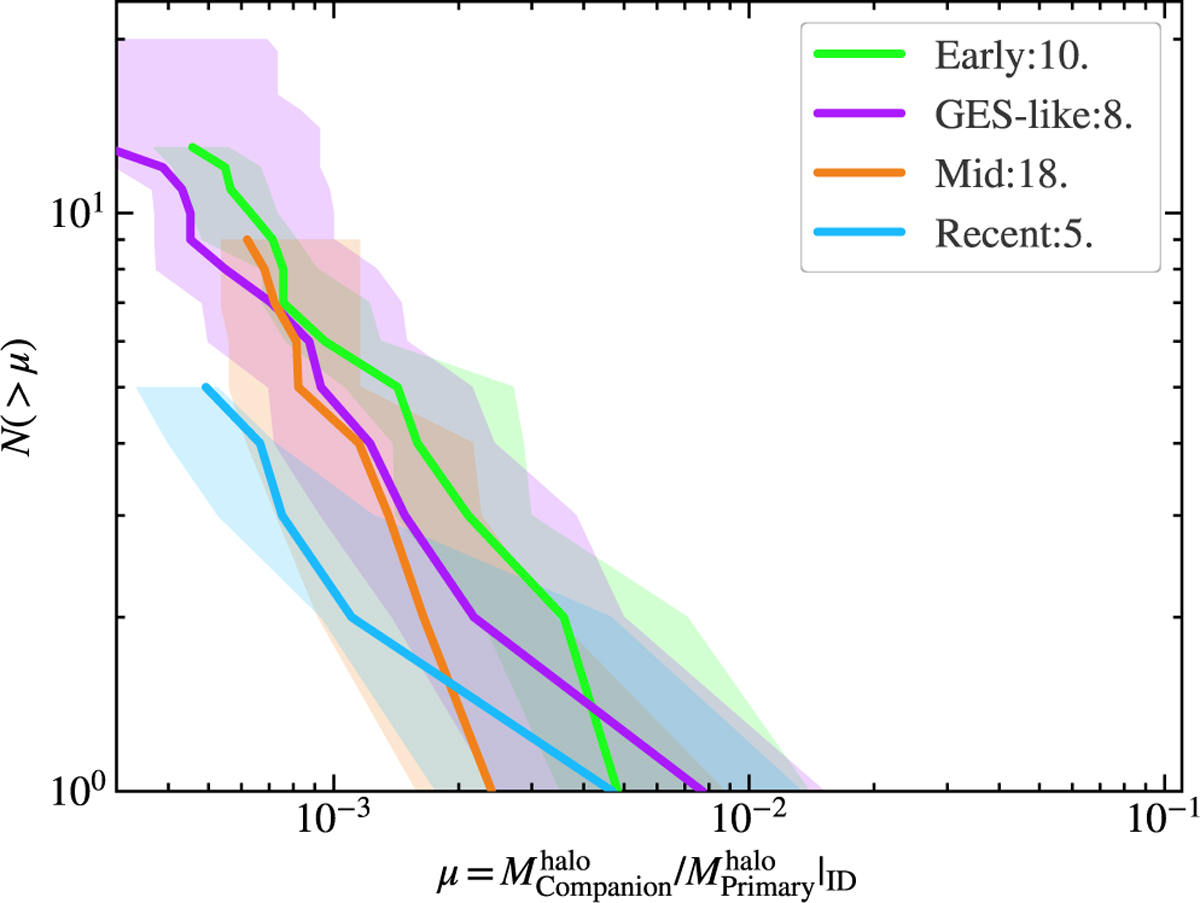
Fig. 5
Download original image
Distributions of the companions’ halo mass as a fraction of the primary satellite’s at the time the group is identified, when the primary satellite first touches the main halo (see Sect. 2 for details). The solid lines correspond to the median of our samples, with the shaded region giving the 1σ, defined as the 16–84% of the distribution. Different colours correspond to our different analogue selections.
Current usage metrics show cumulative count of Article Views (full-text article views including HTML views, PDF and ePub downloads, according to the available data) and Abstracts Views on Vision4Press platform.
Data correspond to usage on the plateform after 2015. The current usage metrics is available 48-96 hours after online publication and is updated daily on week days.
Initial download of the metrics may take a while.