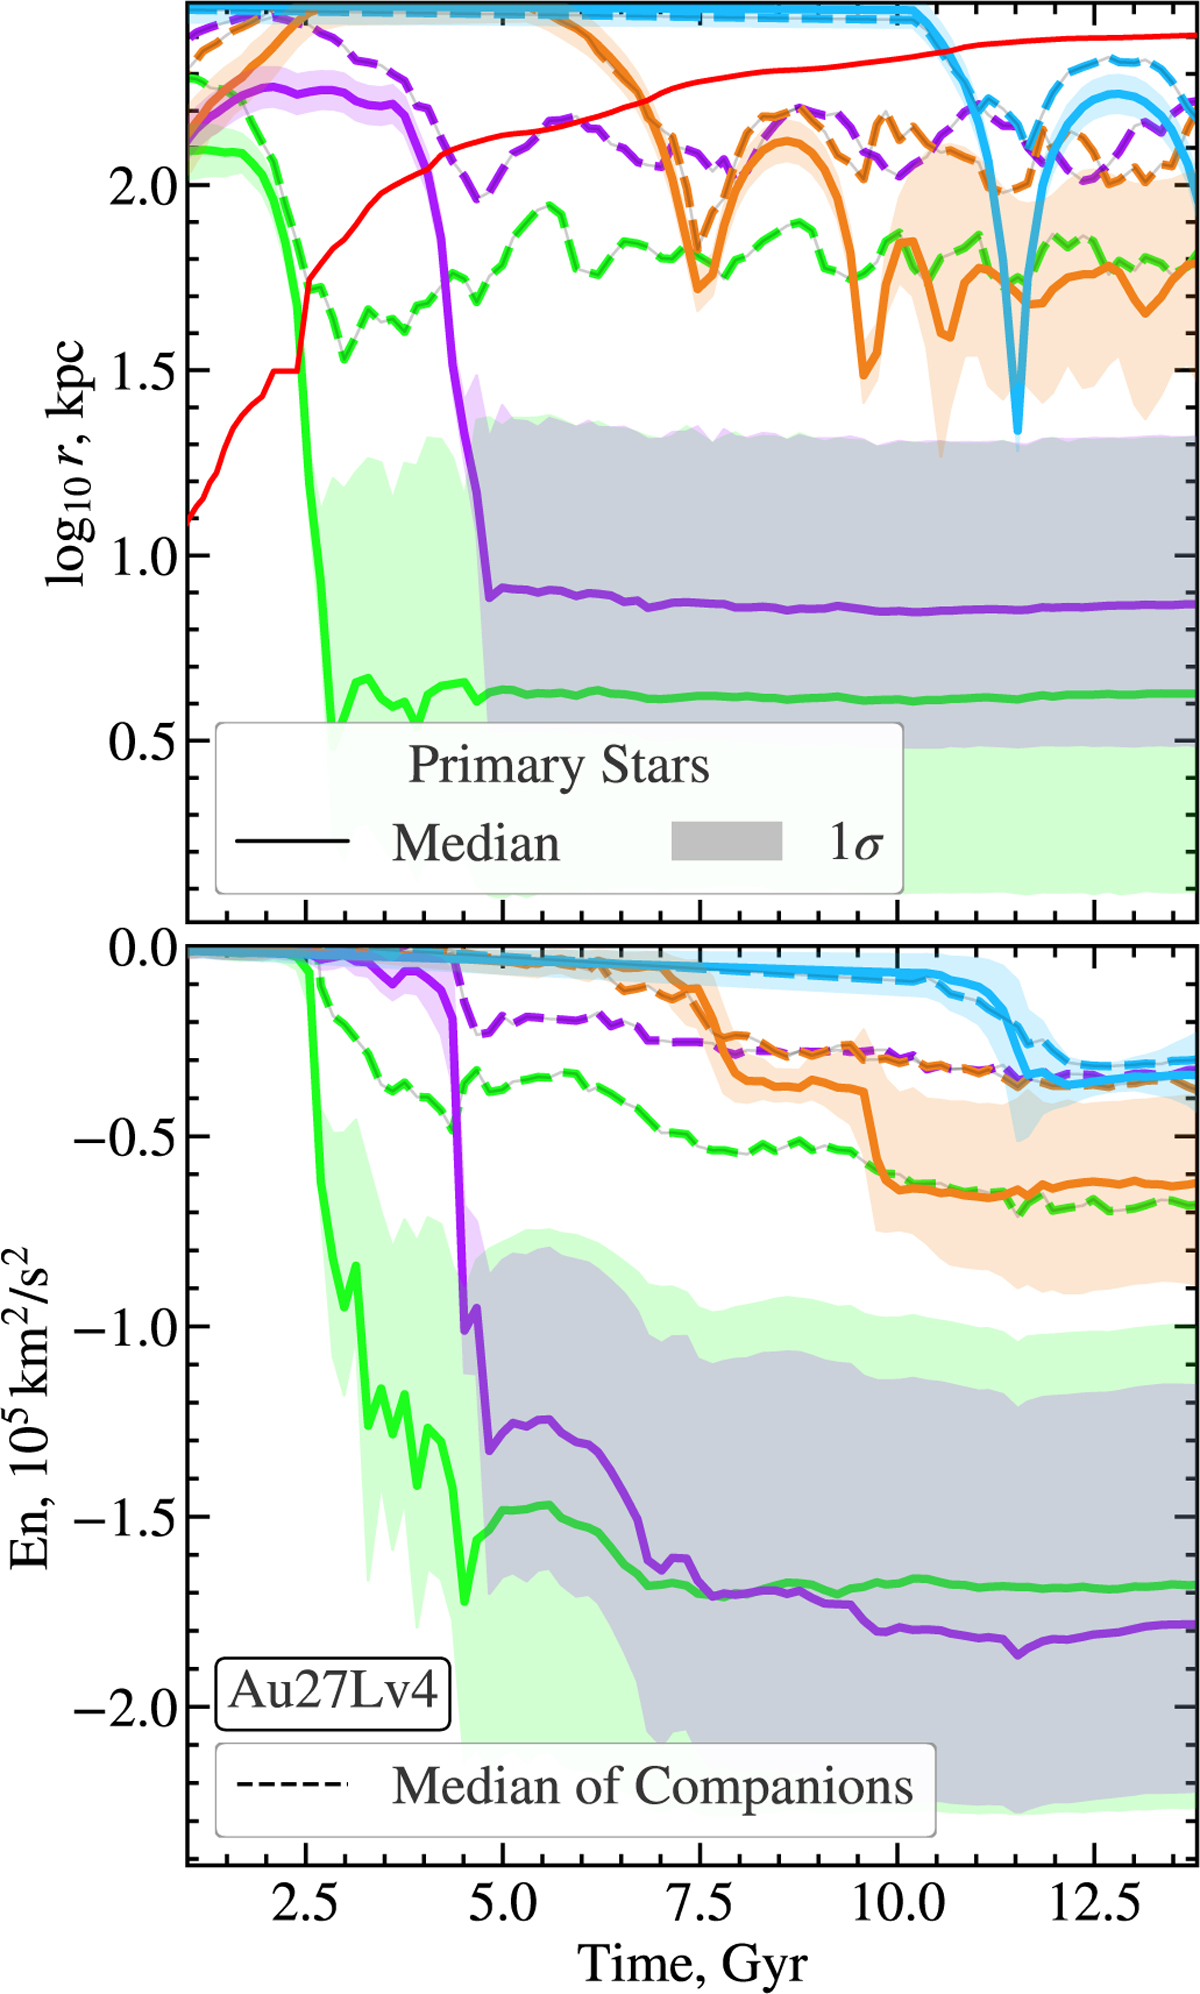
Fig. 6
Download original image
Evolution in radial distance (top) and energy (bottom) for examples of our selected analogues (different colours) over time in AURIGA halo 27. The solid lines correspond to the median of the stellar material of the accretion event, with the shaded region giving the 1σ, defined as 16–84% of the distribution. The dashed lines represent the median of the subhalo companions of group infall, tracked by following the most bound particle at infall.
Current usage metrics show cumulative count of Article Views (full-text article views including HTML views, PDF and ePub downloads, according to the available data) and Abstracts Views on Vision4Press platform.
Data correspond to usage on the plateform after 2015. The current usage metrics is available 48-96 hours after online publication and is updated daily on week days.
Initial download of the metrics may take a while.