Fig. 7
Download original image
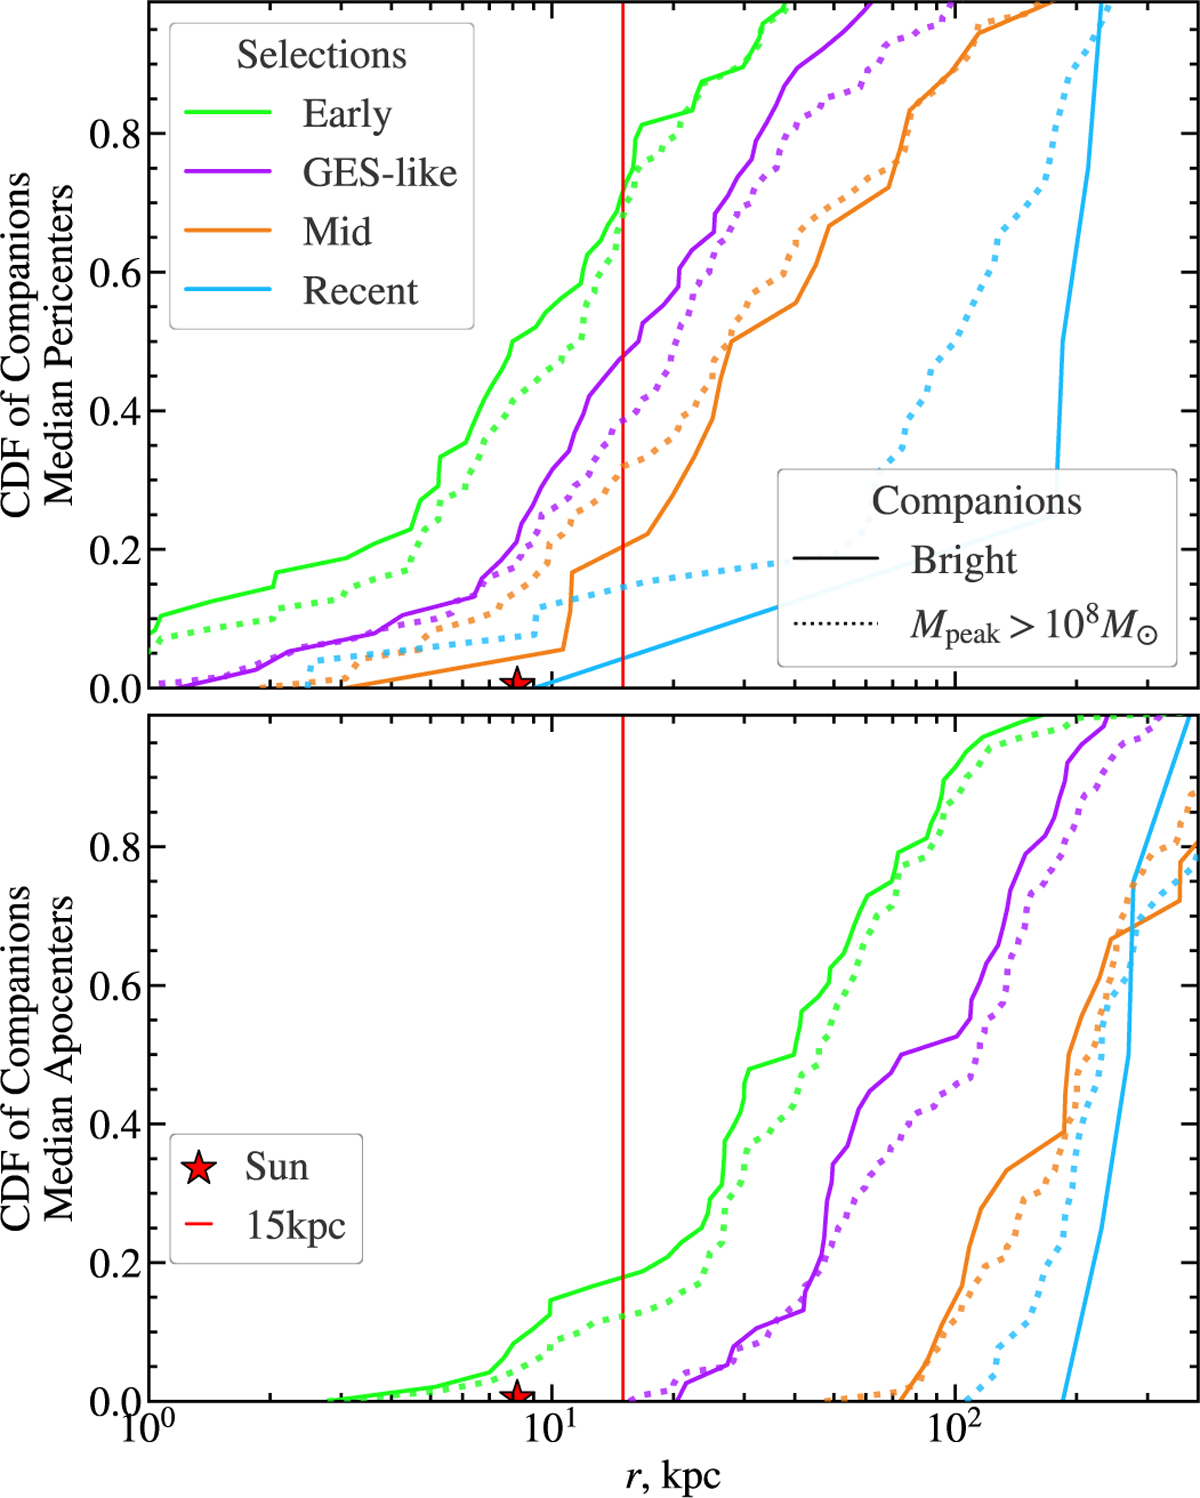
Cumulative Distribution Function of the pericentres (top) and apocentres (bottom) of the material of the companions of group infall events, represented by the particle most bound to the subhalo at infall. The groups are classified by our analogue selection (see Sect. 3 for details), presented in different colours. Two sub-selections of companions are plotted: those that are bright (contain a star particle) are shown with a solid line, and those with a peak total mass greater than 108 M⊙ that could be bright with a dotted line. To compare the radius within different-sized AURIGA haloes, we scaled radial values to the equivalent MW value (see Sect. 4 for details). The vertical red line shows 15 kpc, a generous limit of what can be considered the inner regions and the local stellar neighbourhood.
Current usage metrics show cumulative count of Article Views (full-text article views including HTML views, PDF and ePub downloads, according to the available data) and Abstracts Views on Vision4Press platform.
Data correspond to usage on the plateform after 2015. The current usage metrics is available 48-96 hours after online publication and is updated daily on week days.
Initial download of the metrics may take a while.