Fig. 9
Download original image
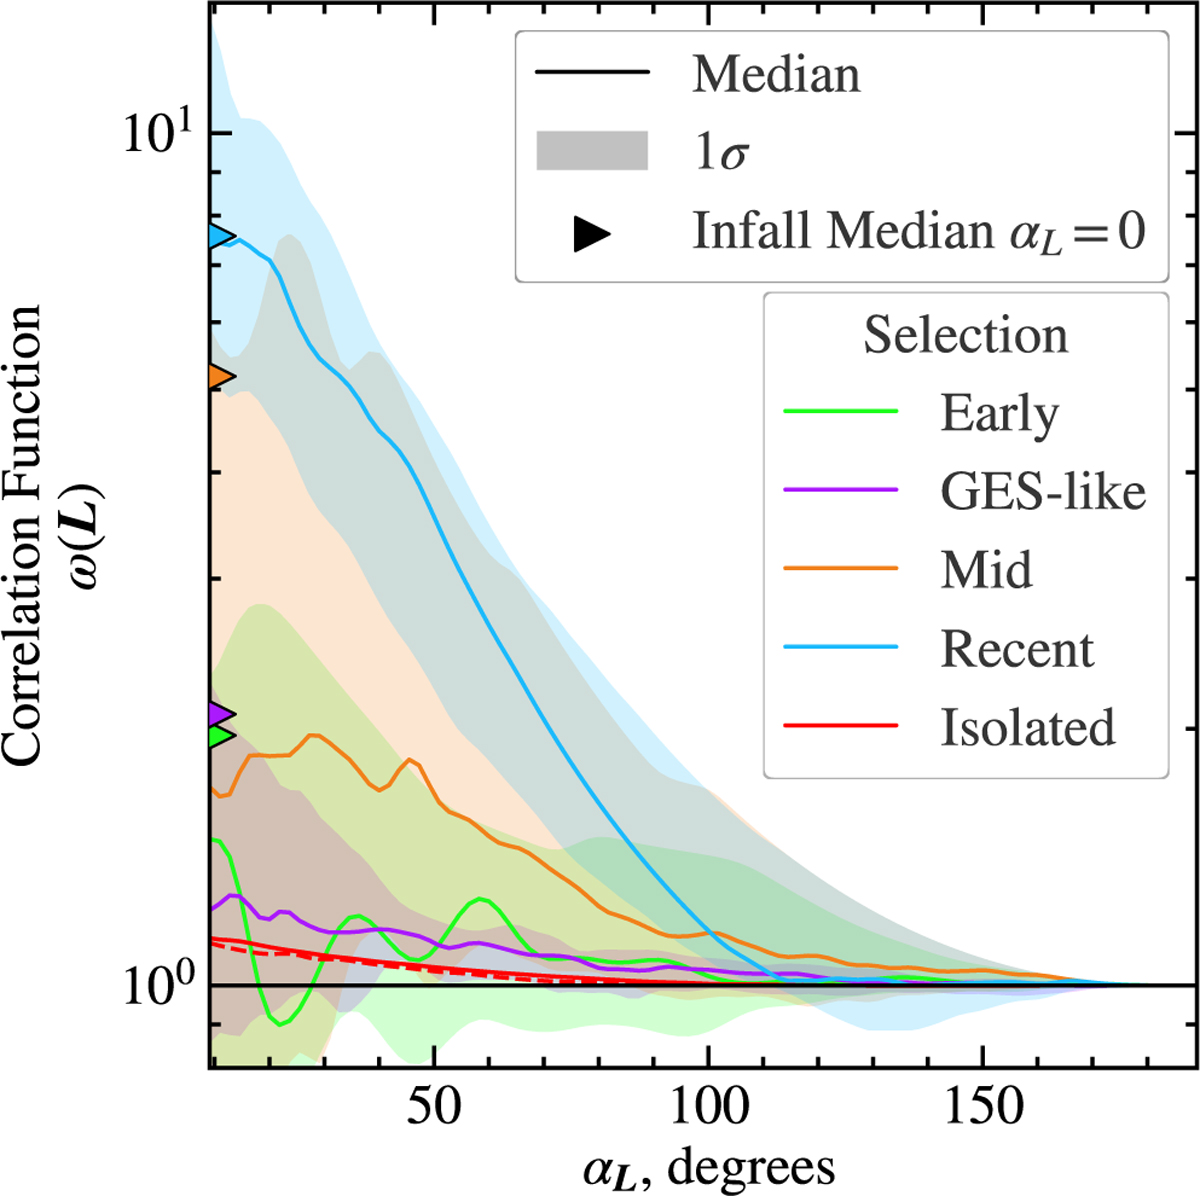
Correlation of selected infall groups’ direction of angular momentum at the present day. The correlation function is the excess of pairs compared to an isotropic distribution on a given angular separation, αL. The different colours correspond to our different selections. The solid line represents the median correlation of our different group samples, with the 1σ scatter (16–84%) within our sample given by the shaded regions. The triangles at αL = 0o correspond to the (median) correlation amplitude on the smallest scale for the different selections at the time of infall.
Current usage metrics show cumulative count of Article Views (full-text article views including HTML views, PDF and ePub downloads, according to the available data) and Abstracts Views on Vision4Press platform.
Data correspond to usage on the plateform after 2015. The current usage metrics is available 48-96 hours after online publication and is updated daily on week days.
Initial download of the metrics may take a while.