Open Access
Fig. 10
Download original image
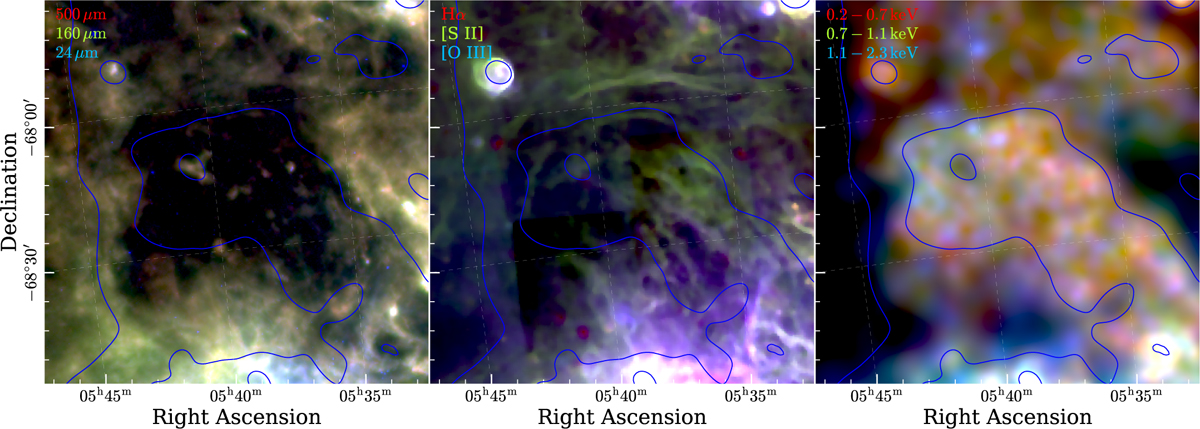
Multiwavelength view of the region of SGS 17 (Kim et al. 1999). This figure is as Fig. 5, but zoomed in on an 80′ box around SGS 17, and showing only far-/mid-infrared, optical emission line, and X-ray images.
Current usage metrics show cumulative count of Article Views (full-text article views including HTML views, PDF and ePub downloads, according to the available data) and Abstracts Views on Vision4Press platform.
Data correspond to usage on the plateform after 2015. The current usage metrics is available 48-96 hours after online publication and is updated daily on week days.
Initial download of the metrics may take a while.