Fig. 4
Download original image
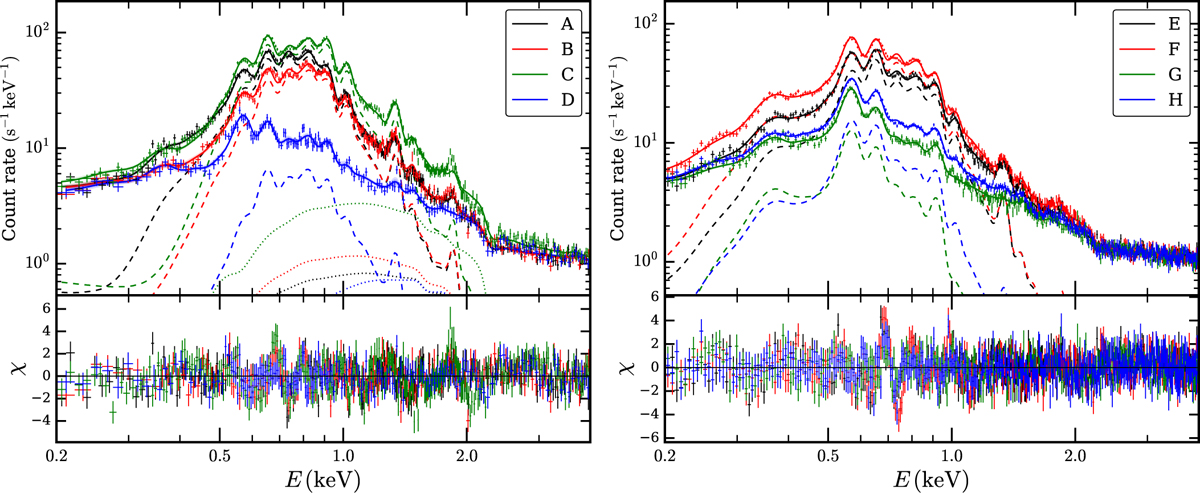
Example spectra from selected regions throughout the LMC. The two panels display the spectra of the different regions in Fig. 2 in the 0.2–4.0 keV range, along with the associated error-weighted residuals in the lower sub-panels. The dashed and dotted lines correspond to the thermal and nonthermal source components, respectively. For display purposes, all spectra were normalized such that their instrumental background levels are identical.
Current usage metrics show cumulative count of Article Views (full-text article views including HTML views, PDF and ePub downloads, according to the available data) and Abstracts Views on Vision4Press platform.
Data correspond to usage on the plateform after 2015. The current usage metrics is available 48-96 hours after online publication and is updated daily on week days.
Initial download of the metrics may take a while.