Fig. 5
Download original image
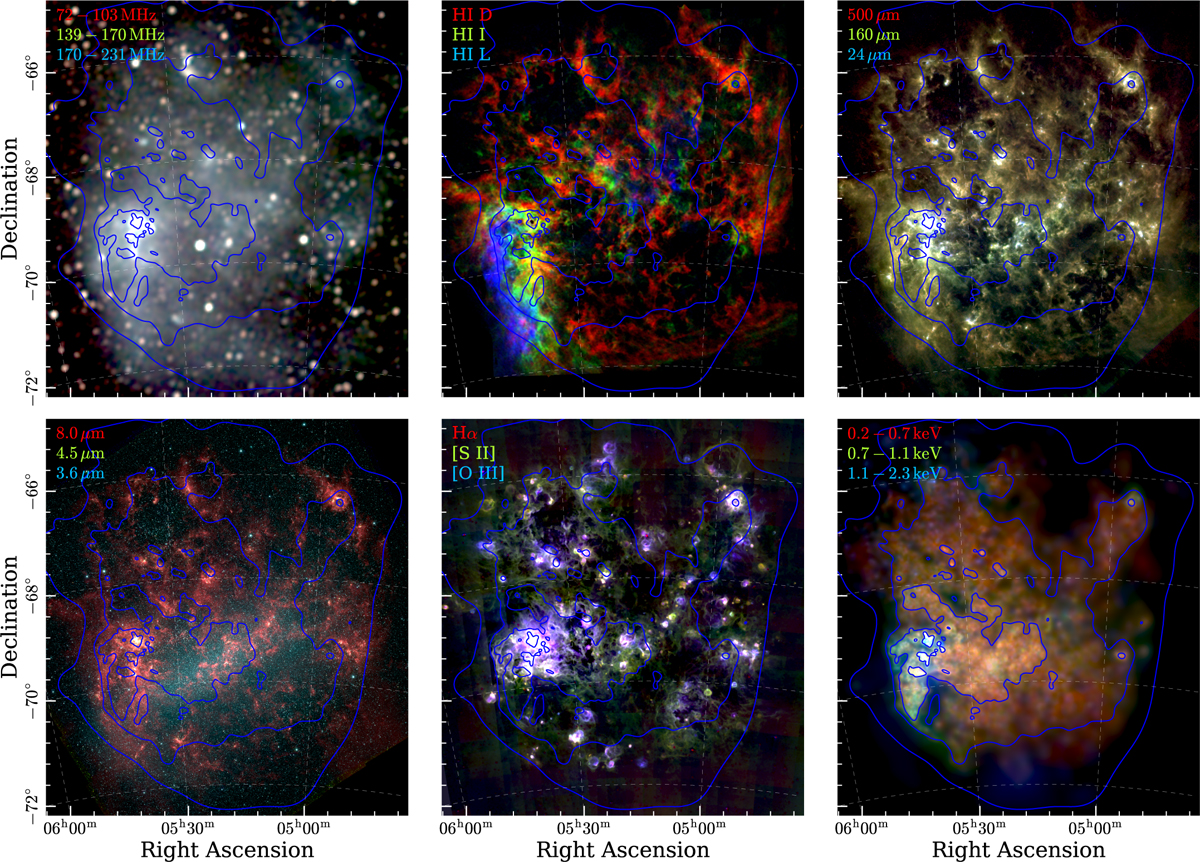
Multiwavelength view of the LMC. Each panel displays the emission in the region of the LMC in a different energy range. This includes the GLEAM low-frequency radio continuum (top left), ATCA and Parkes H I line emission (top center), far- to mid-infrared (top right), near-infrared (bottom left), optical emission lines (bottom center), and diffuse X-rays (bottom right). The blue contours superimposed on each image correspond to the brightness of the diffuse X-ray emission in the 0.2–2.3 keV band. In all panels, a false-color rendering of the data using three independent energy bands is shown, with the frequency increasing from red to green to blue bands. The exception is the image of optical emission lines, where Hα, [S II], and [O III] were assigned to red, green, and blue, respectively.
Current usage metrics show cumulative count of Article Views (full-text article views including HTML views, PDF and ePub downloads, according to the available data) and Abstracts Views on Vision4Press platform.
Data correspond to usage on the plateform after 2015. The current usage metrics is available 48-96 hours after online publication and is updated daily on week days.
Initial download of the metrics may take a while.