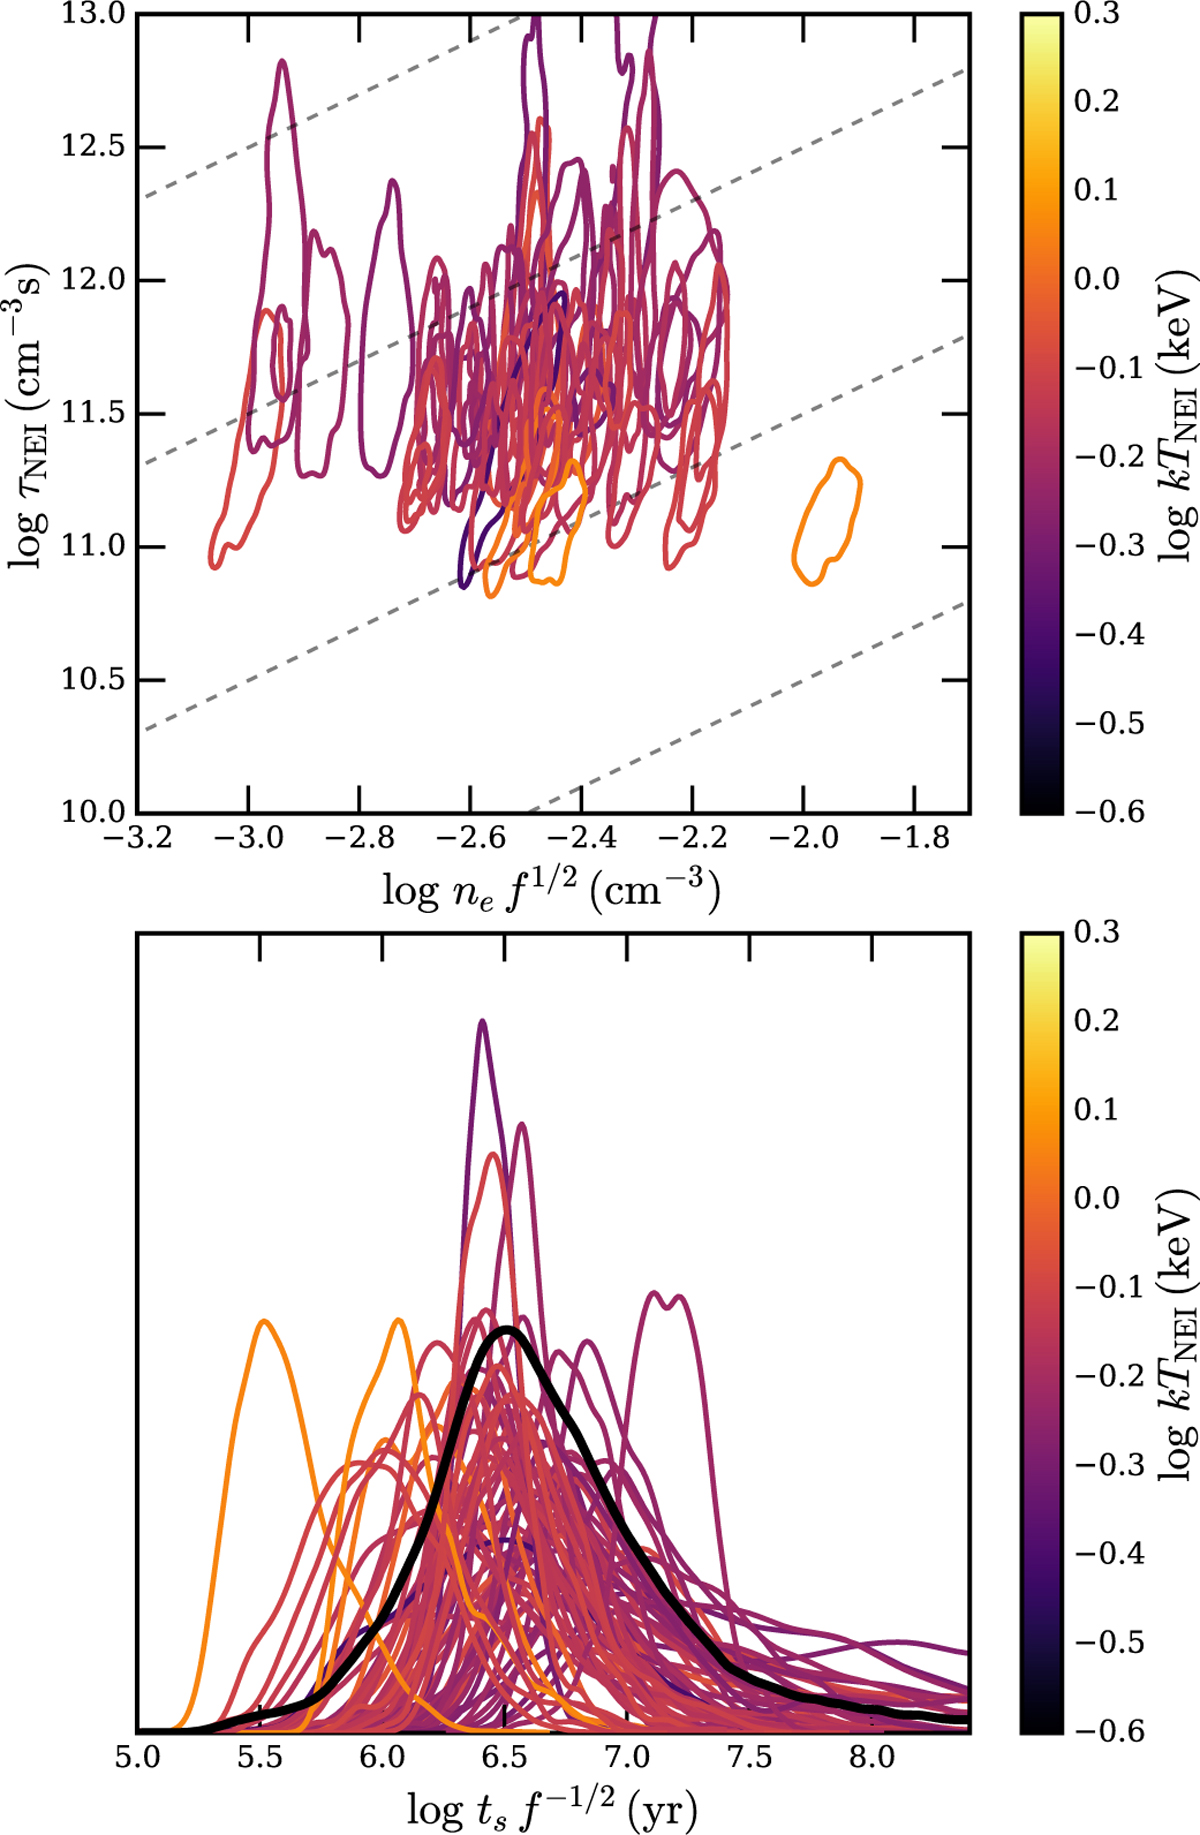
Fig. 8
Download original image
Constraints on NEI in the hot plasma component. The top panel shows the joint 1 σ-contours of the density ne and ionization timescale τNEI inferred for the hot plasma component in each region. The dashed gray lines correspond to constant shock age ts, and are logarithmically spaced between 105 and 108 yr. In the bottom panel, the constraints are converted into probability distributions of ts. The thick black line indicates the combined distribution of all regions. In both panels, the line colors indicate the electron temperature kTNEI fit for the respective region.
Current usage metrics show cumulative count of Article Views (full-text article views including HTML views, PDF and ePub downloads, according to the available data) and Abstracts Views on Vision4Press platform.
Data correspond to usage on the plateform after 2015. The current usage metrics is available 48-96 hours after online publication and is updated daily on week days.
Initial download of the metrics may take a while.