Fig. 9
Download original image
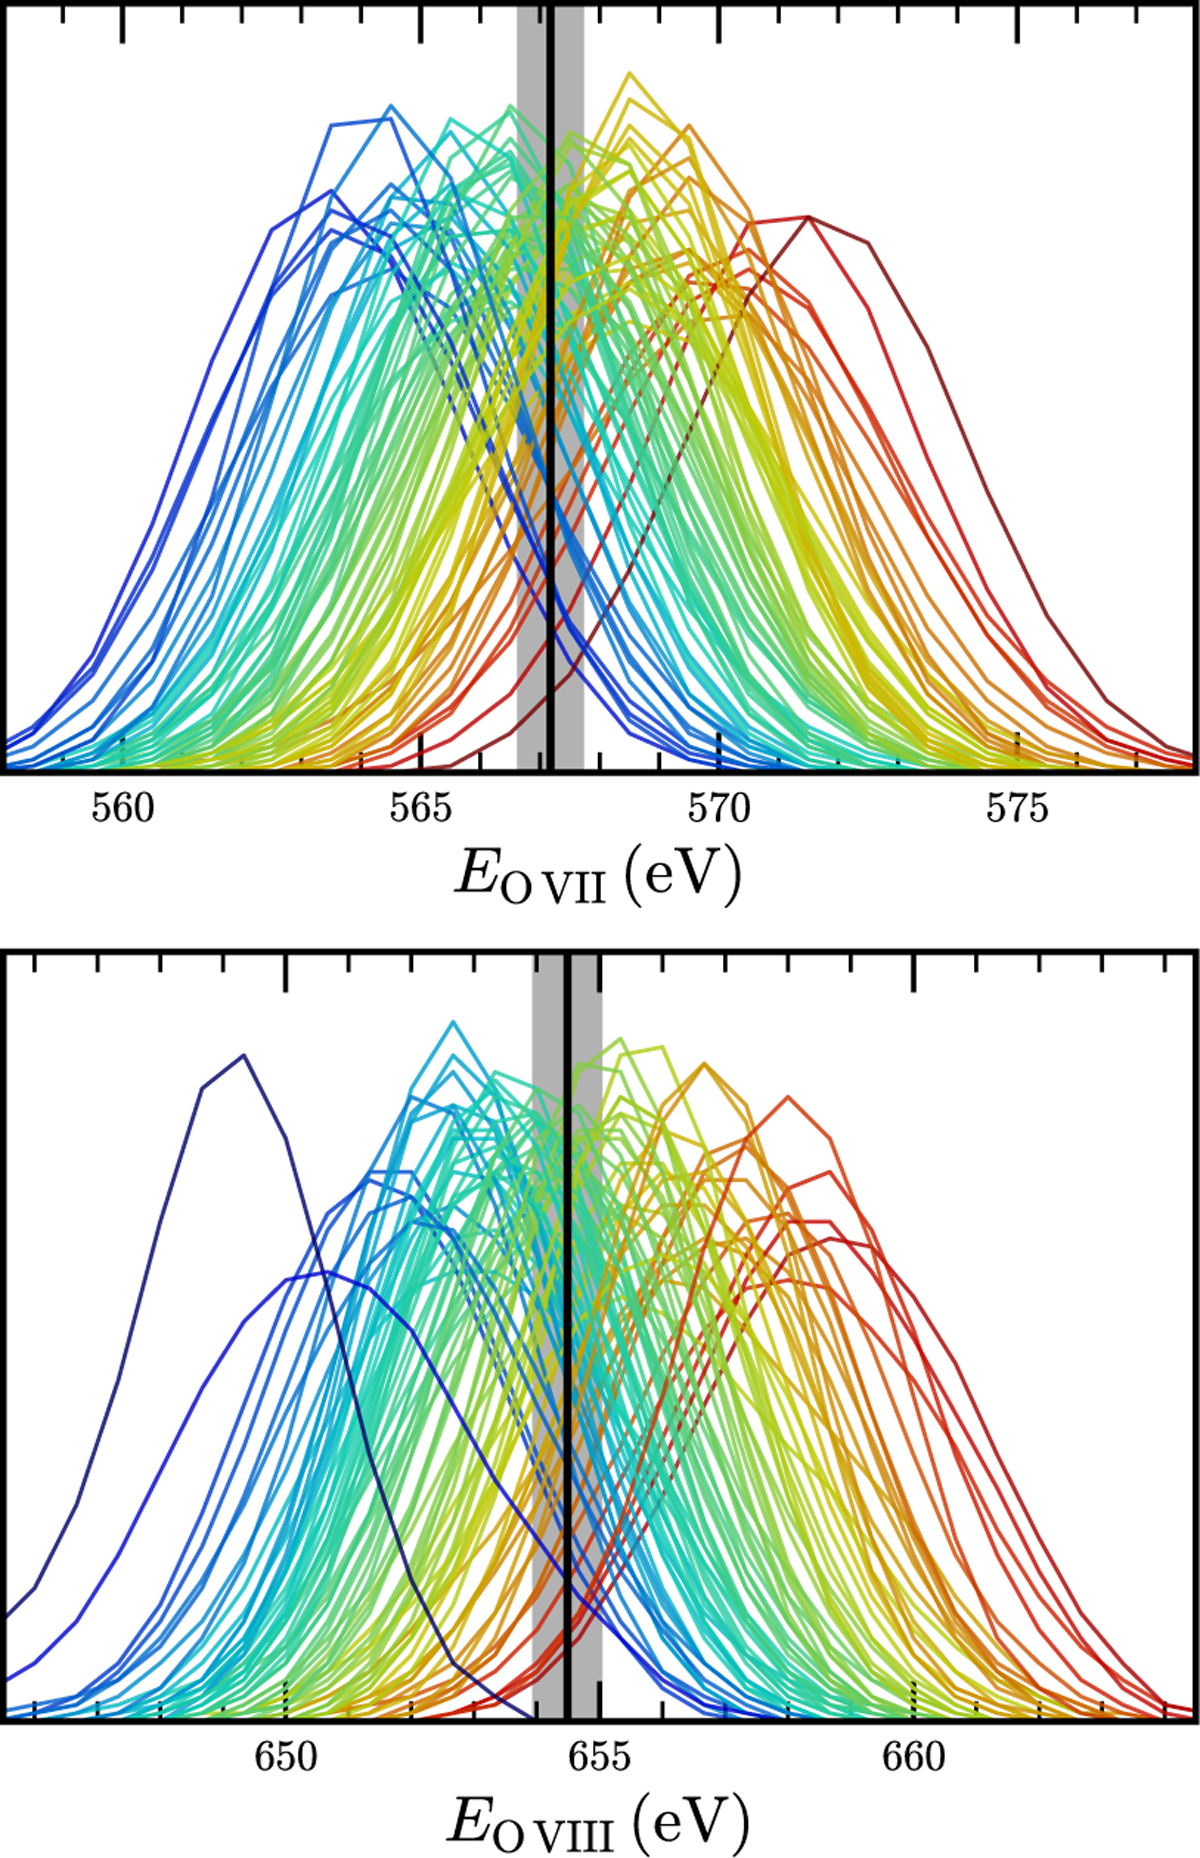
Centroid determination of O VII (top) and O VIII (bottom) lines. In both panels, we display the probability distribution functions for the centroid energy of all regions where both lines were detected with at least 10σ significance. The vertical black lines mark the mean line centroid energies, constructed via a weighted average over all regions, and the shaded areas indicate the corresponding 3σ uncertainties. The color scale reflects the mean centroid energies, purely for the purpose of visual differentiation.
Current usage metrics show cumulative count of Article Views (full-text article views including HTML views, PDF and ePub downloads, according to the available data) and Abstracts Views on Vision4Press platform.
Data correspond to usage on the plateform after 2015. The current usage metrics is available 48-96 hours after online publication and is updated daily on week days.
Initial download of the metrics may take a while.