Open Access
Fig. C.3
Download original image
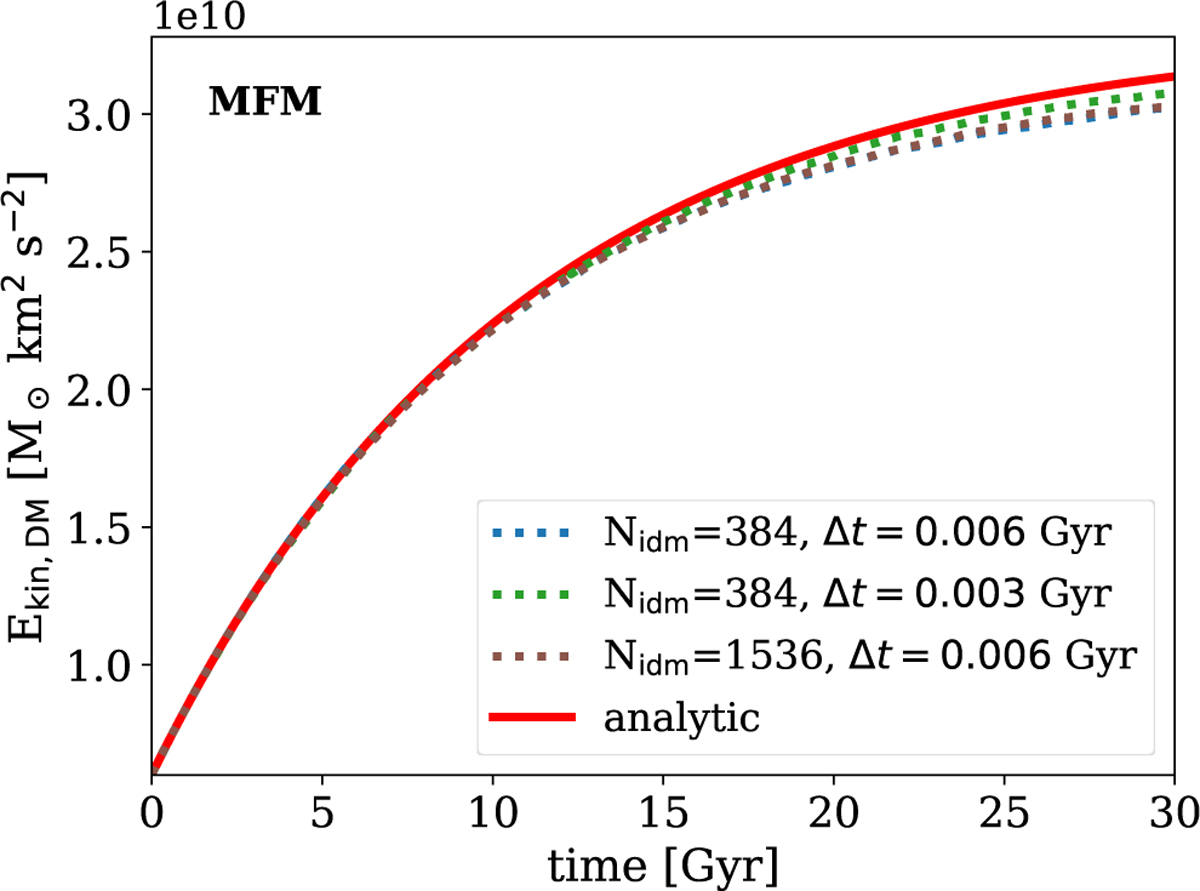
Varying the time step and the interaction number for the heat conduction test problem. The kinetic energy of the DM is shown as a function of time. Simulation results are indicated by the dotted lines and the analytic solution is given by the solid red line. We note this is the same as in Fig. C.1 but for MFM.
Current usage metrics show cumulative count of Article Views (full-text article views including HTML views, PDF and ePub downloads, according to the available data) and Abstracts Views on Vision4Press platform.
Data correspond to usage on the plateform after 2015. The current usage metrics is available 48-96 hours after online publication and is updated daily on week days.
Initial download of the metrics may take a while.