Fig. C.4
Download original image
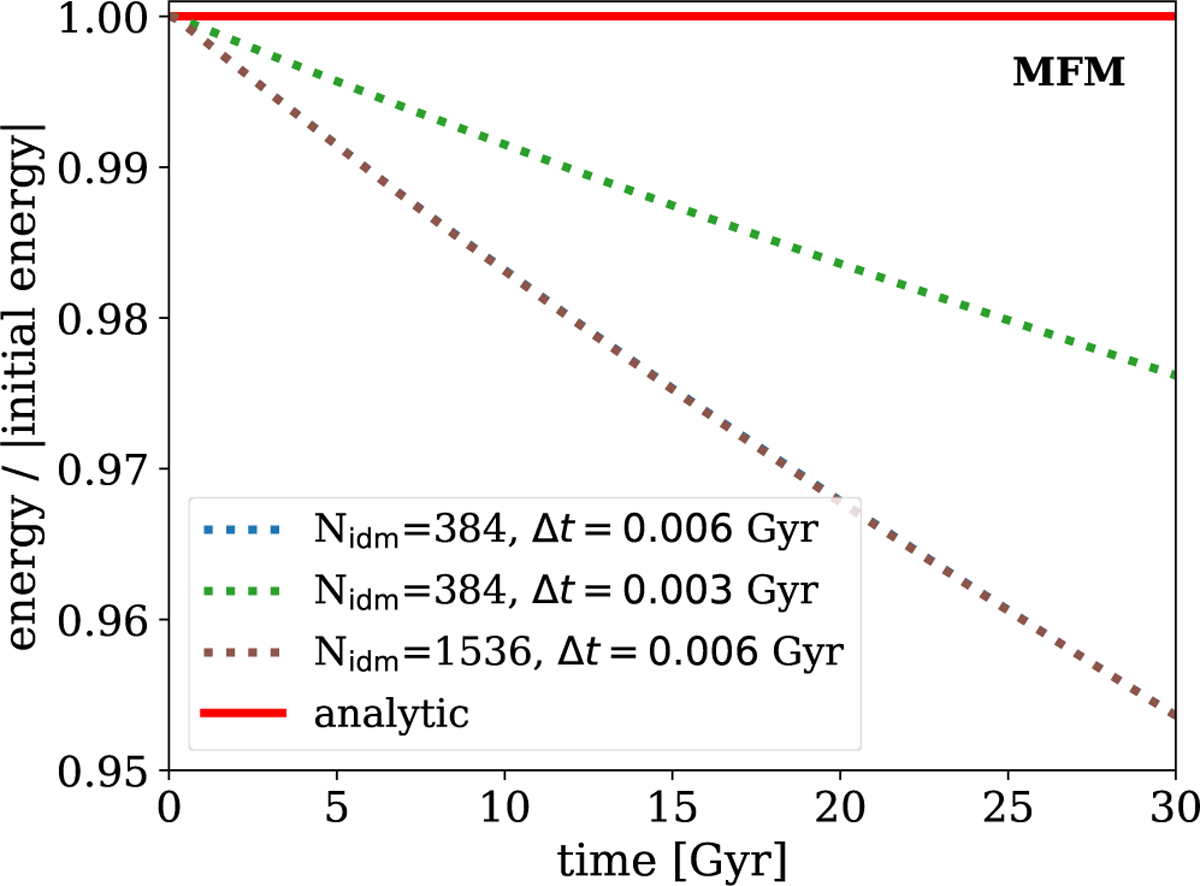
Energy conservation for the heat conduction test problem as a function of time with varying time steps and interaction numbers. The results of the same simulations as used for Fig. C.3 are displayed by the dotted lines and the expectation for perfect energy conservation is indicated by the red line. We note this is the same as in Fig. C.2 but for MFM.
Current usage metrics show cumulative count of Article Views (full-text article views including HTML views, PDF and ePub downloads, according to the available data) and Abstracts Views on Vision4Press platform.
Data correspond to usage on the plateform after 2015. The current usage metrics is available 48-96 hours after online publication and is updated daily on week days.
Initial download of the metrics may take a while.