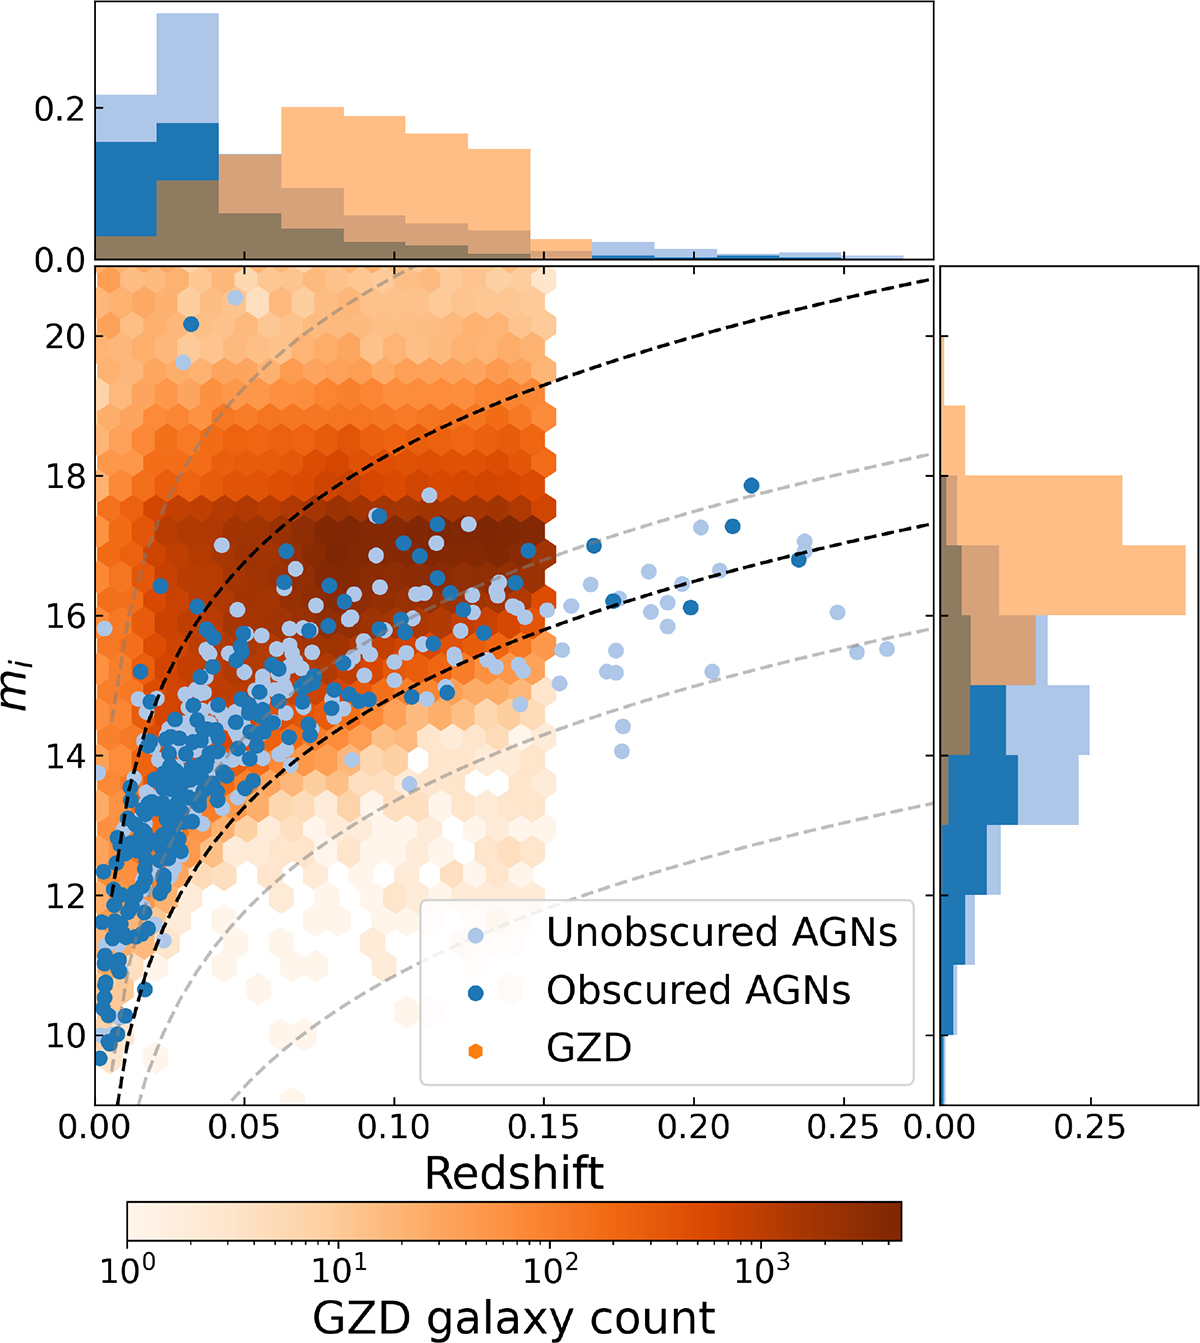
Fig. 5.
Download original image
Observed redshift and i-mag distributions for BASS Seyferts and GZD galaxies. Only galaxies with i-mag measurements are included. Note that although the BASS Seyferts in general cover a redshift range up to z = 0.52, for visualization purposes we limit the plot to z < 0.28, where ∼98% of BASS Seyferts are accounted for. The dashed curves represent constant absolute magnitudes, with most of the BASS sample falling between −20 and −23.5 as represented by the black curves.
Current usage metrics show cumulative count of Article Views (full-text article views including HTML views, PDF and ePub downloads, according to the available data) and Abstracts Views on Vision4Press platform.
Data correspond to usage on the plateform after 2015. The current usage metrics is available 48-96 hours after online publication and is updated daily on week days.
Initial download of the metrics may take a while.