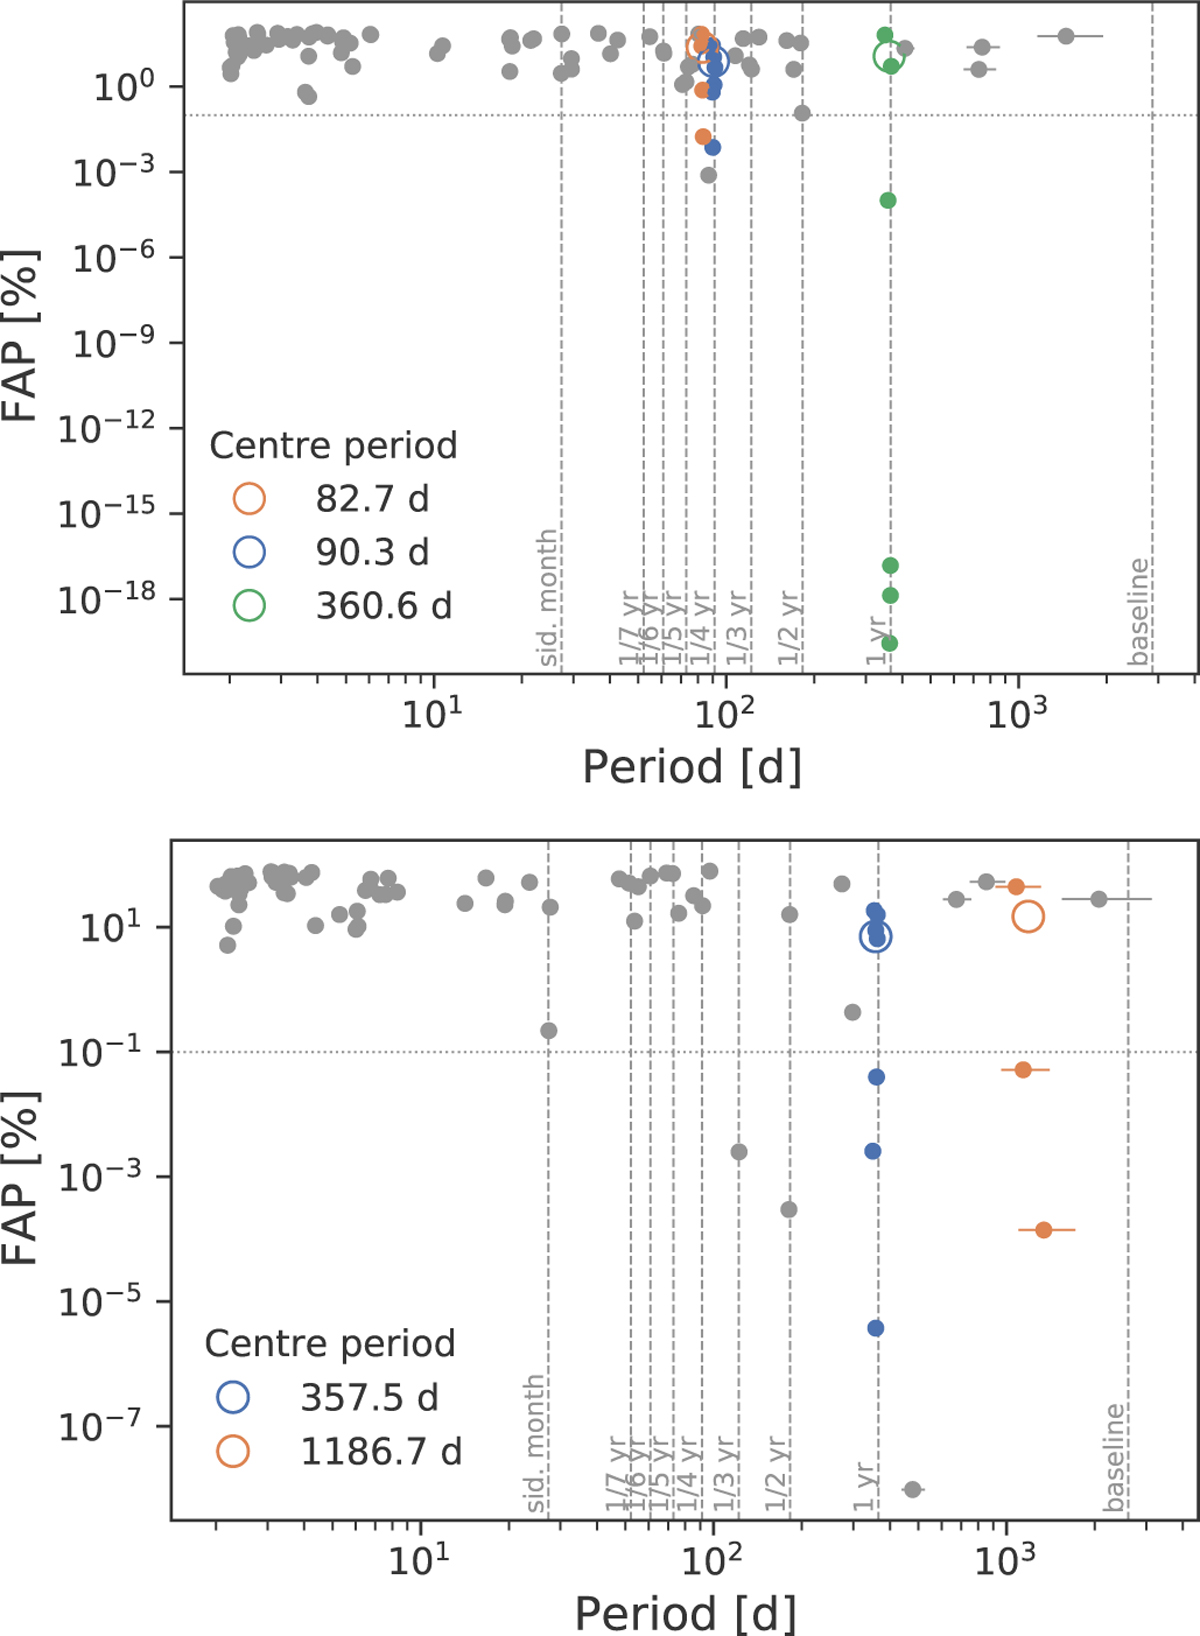
Fig. 1
Download original image
Clustering periodogram analysis (Kemmer et al. 2025) for the activity indices of GJ 3512 (top) and GJ 9773 (bottom). The 0.1% FAP threshold is shown as a horizontal dotted grey line, while vertical dashed lines mark the position of common periods caused by the sampling of data and their harmonics as labelled. Symbols with different colours correspond to clusters of periods that appear on different activity indicators. The mean values are reported in the legend.
Current usage metrics show cumulative count of Article Views (full-text article views including HTML views, PDF and ePub downloads, according to the available data) and Abstracts Views on Vision4Press platform.
Data correspond to usage on the plateform after 2015. The current usage metrics is available 48-96 hours after online publication and is updated daily on week days.
Initial download of the metrics may take a while.