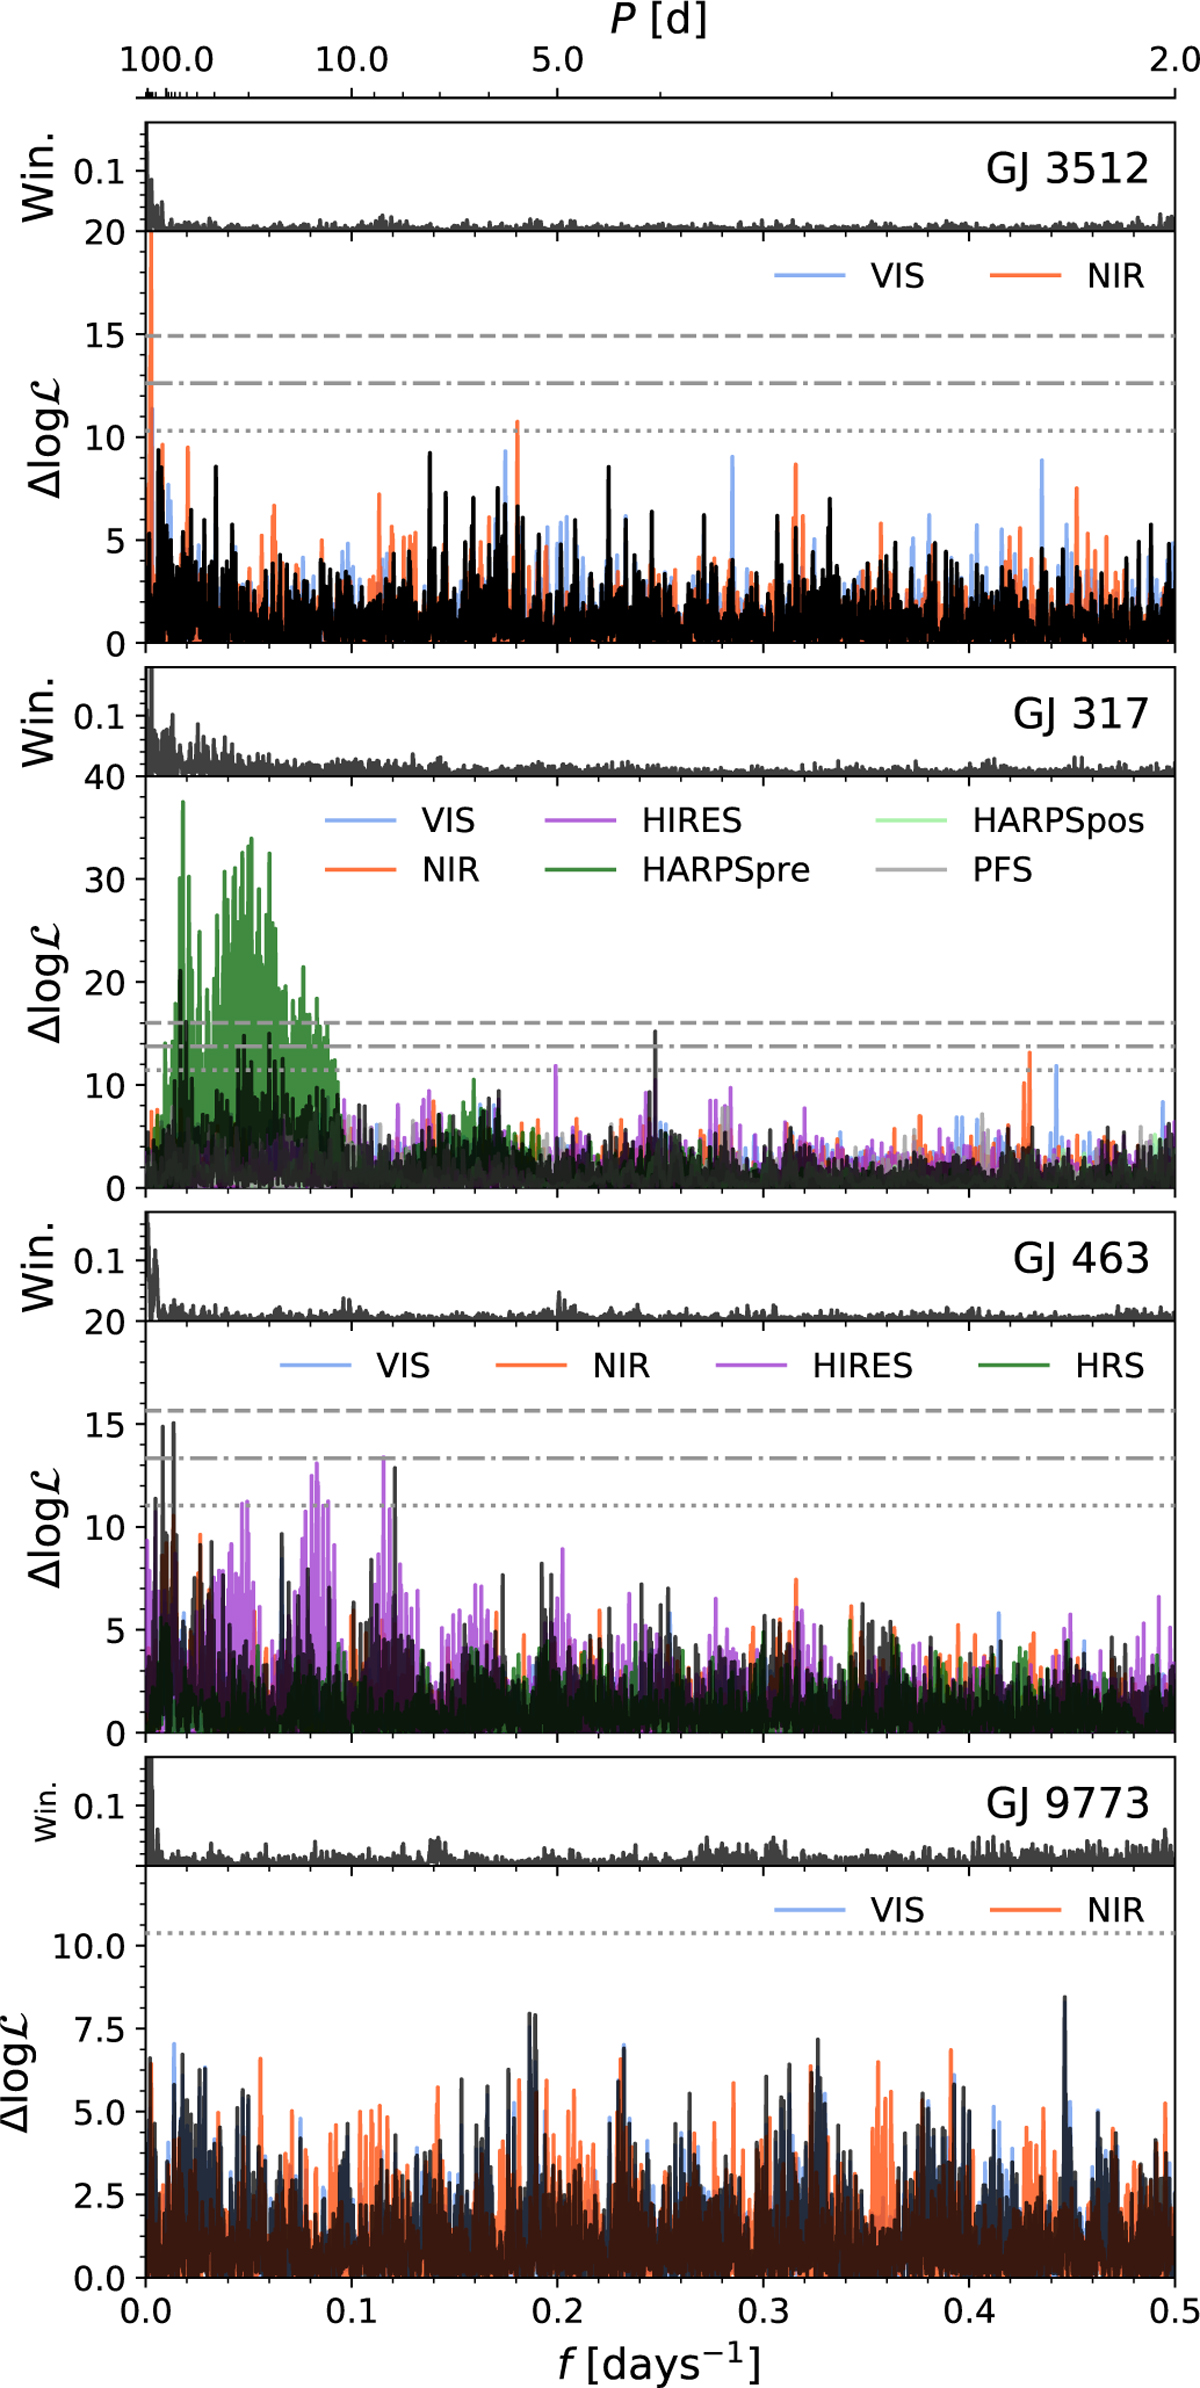
Fig. 5
Download original image
Periodogram of the residuals from the fits to the RV datasets of GJ 3512, GJ 317, GJ 463, and GJ 9773 (from top to bottom). In each panel the solid black line corresponds to the joint periodogram of all datasets, while solid lines depict the periodogram for each individual dataset as labelled. The top panel for each target illustrates the window function. Solid horizontal grey lines show the 0.1% (dashed), 1% (dot-dashed), and 10% (dotted) FAP levels.
Current usage metrics show cumulative count of Article Views (full-text article views including HTML views, PDF and ePub downloads, according to the available data) and Abstracts Views on Vision4Press platform.
Data correspond to usage on the plateform after 2015. The current usage metrics is available 48-96 hours after online publication and is updated daily on week days.
Initial download of the metrics may take a while.